Graphics Programs Reference
In-Depth Information
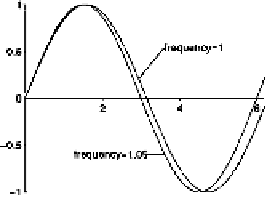
Companion M-Files Feature 2
To label many curves on a
plot it is better to put the text close to the curves themselves rather
than in a separate legend off to one side. Legends force the eye
to make many jumps between the plot and the legend to sort out
which line is which. Although
matlab
comes equipped with a
legend
function, I prefer to use the companion m-file
curlabel
,
which is good especially for labelling plots which are close together:
t = 0:.1:2*pi;
plot(t,sin(t),t,sin(1.05*t))
curlabel('frequency = 1')
curlabel('frequency = 1.05')
axis([0 max(t) -1 1])
zeroaxes
You must use the mouse to specify the start and end points of the
pointer lines. The echo from the function can be pasted into an
m-file for future use.
5 More Matrix Algebra
You can multiply two matrices together using the
*
operator:
>>a=[12;34]
a=
1 2
3 4
>>b=[1010;0110]
b=
1
0
1
0
0
1
1
0
>> a*b
ans =
1
2
3
0
3
4
7
0
>>u=[1201]
u=
1
2
0
1
>>v=[1122]'