Graphics Programs Reference
In-Depth Information
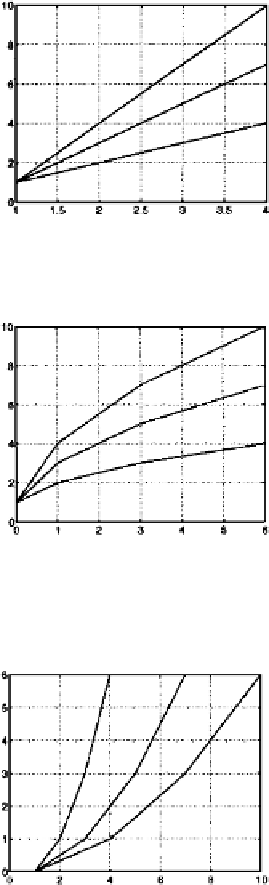
4.3 Plotting Matrices
If one of the arguments to the
plot
command is a matrix, matlab will
use the columns of the matrix to plot a set of lines, one line per column:
>>q=[111;234;357;4710]
q=
1
1
1
2
3
4
3
5
7
4
7
10
>> plot(q)
>> grid
matlab plots the columns of the matrix
q
against the row index. You
can also supply an
x
variable:
>>x=[0136]
x=
0
1
3
6
>> plot(x,q)
>> grid
Here the
x
values are not uniformly spaced, but they are the same for
each column of
q
. You can also plot a matrix of
x
values against a vector
of
y
values (be careful: the
y
values are in the vector
x
):
plot(q,x)
grid
If both the
x
and
y
arguments are matrices, matlab will plot the suc-
cessive columns on the same plot: