Graphics Programs Reference
In-Depth Information
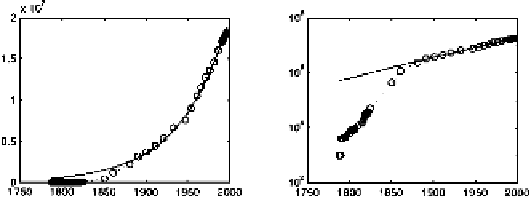
If you zoom in on the right hand plot you'll find that this growth rate is
too fast for the period between 1990 and 1996.
Exercise 5 (Page 55)
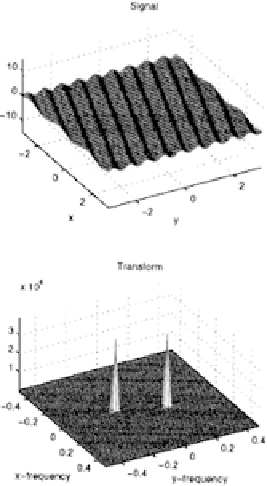
The following m-file illustrates how to generate a 2-dimensional sinusoid
and its FFT. Experiment with the relative
x
and
y
frequencies and see
the effect on the FFT. Try different functions of
x
and
y
. Try adding
some noise. Try plotting the logarithm of
P
.
t=linspace(-pi,pi,64);
[x,y]=meshgrid(t);
z = sin(3*x + 9*y);
Z = fft2(z);
P = fftshift(abs(Z).^2);
f = fftfreq(0.5, length(t));
clf
colormap([0 0 0])
subplot(221)
mesh(x,y,z)
axis([-pi pi ...
-pi pi ...
-15 15])
view([60 50])
xlabel('x')
ylabel('y')
title('Signal')
subplot(223)
mesh(f,f,P)
axis tight
view([60 50])
xlabel('x-frequency')
ylabel('y-frequency')
title('Transform')