Graphics Programs Reference
In-Depth Information
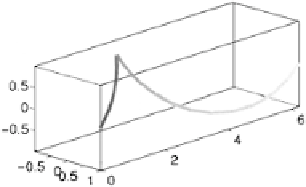
The
patch
function has automatically joined the first and last points,
which we do not want to do. We can get rid of that line by setting the
final colour of the
FaceVertexCData
matrix to be
NaN
:
>> fvc(20,:) = NaN
fvc =
0
0.5000
0.4000
0.0526
0.52630.4000
[...]
0.8947 0.9474 0.4000
0.9474 0.9737 0.4000
NaN NaN NaN
>> set(h,'facevertexcdata',fvc)
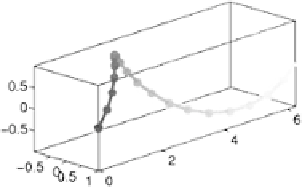
As for most other instances of plotting
NaN
s, matlab handles not-a-
number elements by leaving them out. Our final plot of the cable omits
the points:
>> set(h,'marker','none')
Example: Coloured Cylinder
Suppose a cylindrical section of pipe
is heated and that it develops a temperature distribution such that the
temperature anywhere on its surface depends on the distance from the
point of heating. We will use a single call to the patch command to
draw the cylinder and display the temperature coded as different colours
on the cylinder's surface. We define the cylinder by defining the two
rings at its ends. We will use the vertex-and-faces method of spec-
ifying the patch, and num-
ber the vertices according to
the scheme shown in this dia-
gram. The vertices at the
bottom are numbered from 1
to
N
; the vertices at the top
are numbered from
N
+1 to
2
N
. The first face will be
formed by joining vertices 1,
N
+1,
N
+ 2 and 2. The
second face will be formed by
joining vertices 2,
N
+2,
N
+3
and 3; and so on. The final
face will be formed by joining vertices
N
,2
N
,
N
+ 1 and 1.
N
is equal
to 20 in the diagram shown here. We start by defining the
x
,
y
, and
z
coordinates that we need: