Graphics Programs Reference
In-Depth Information
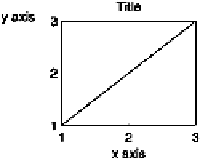
These commands change special Text objects that are associated with
the Axes object:
>> yl = get(gca,'ylabel');
>> get(yl,'String')
ans =
y axis
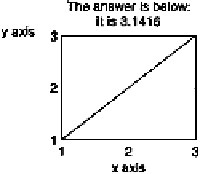
>> set(yl,'Rotation',0)
>> pos = get(yl,'pos');
>> set(yl,'pos',[0.35 3])
To be friendly to the viewers of your graphs, you should always place
your
y
labels horizontally. Multi-line labels can be done easily using cell
arrays:
>> str = {'The answer is below:';
['It is ' num2str(pi)]}
str =
'The answer is below:'
'It is 3.1416'
>> title(str)
33 Text in Graphics
The commands
xlabel
,
ylabel
,
zlabel
, and
title
are used to put text
in special places around the plot. A general way to place text is to use
text
commands:
x = 0:.01:2;
plt(x,humps(x))
axis tight
[ym,i] = max(humps(x));
str = ['Maximum value: ' ...
num2str(ym)];
text(x(i),ym,str)
The first two inputs to
text
define the
x
and
y
coordinates of the text's
reference point. (The
gtext
command allows you to define the reference
point with the mouse.) You can give a third,
z
-value, to the
text
com-
mand to place text on three-dimensional plots. Issuing
text
commands
creates Text objects, which have a great many properties (type
get(h)
,
where
h
is the handle of a Text object). Often you want to change the
way the text is aligned to its reference point. By default, text is hori-
zontally aligned such that the left-hand edge is near the reference point,
and vertically aligned such that the middle of the text is near the refer-
ence point. The following diagrams show the effect of changing a Text