Graphics Programs Reference
In-Depth Information
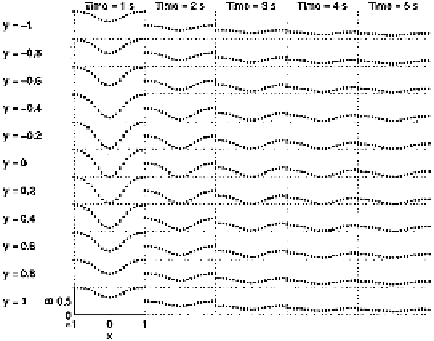
for yi = 1:Ny
for ti = 1:Nt
count = count + 1;
pos = pickbox(Ny,Nt,count,0,0,.2);
ax = axes('pos',pos,...
'ylim',[0top],...
'nextplot','add',...
'visible','off');
plt(xv,B(:,yi,ti),'.') % Data
plt([-1 -1 1],[1 0],'k:') % Dotted frame
if count~ = 51
set(gca,'xticklabel','',...
'yticklabel','')
end
if count = = 51
axis on
xlabel('x')
ylabel('B')
end
if count<6
text(0,1.2,['Time = ' ...
num2str(tv(ti)) ' s'],...
'HorizontalAlignment','center')
end
if rem(count-1,5) = = 0
text(-3,0.5,['y = ' ...
num2str(yv(yi))])
end
end
end
For these kinds of plot arrays it is essential to keep the axes' scales
fixed for all the plots. The axes' scales are fixed by setting the
YLim