Graphics Programs Reference
In-Depth Information
The
axis
command works by changing various properties of Axes
objects. If you look inside the
axis
, function (
type axis
) you will
see many
set
commands used to change Axes properties. As we said
before, the
axis
command gives you an easy way to change frequently
used Axes features. Some Axes properties are not part of the
axis
command's functionality; you must change them yourself. For example,
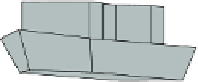
when drawing physical objects rather than mathematical abstractions,
realism is improved by allowing perspective distortion. Compare these
two views of a ship seen from about wharf height:
13
clf
subplot(221);
ship
axis off
pos = [11 2.3.55];
set(gca,'CameraPosition',pos)
subplot(223);
ship
set(gca,'CameraPosition',pos,...
'Projection','Perspective')
axis off
Here
ship
is an m-file on disk that draws the patches representing the
ship.
As another example, here is what you might see if you were an ant
crawling along a doughnut (the command
torus
is part of the companion
software to this topic):
clf
[x,y,z] = torus(.5,90,1);
surfl(x,y,z,[150,50],[0 1 0 0])
colormap(fitrange(gray,0.5,1))
axis equal
axis off
axis vis3d
pos = [[1 1]*1.1 .7];
set(gca,'CameraPosition',pos)
set(gca,'CameraTarget',[0 .8 .4])
set(gca,'Projection','Perspective')
Exercise 17
When you have driven past a vineyard or an
orchard, have you ever noticed the many directions in which the
plants seem to line up? Create an evenly spaced grid of points,
and see if you can get
matlab
to display the same kind of effect.
(Answer on page 191.)
13
The working of
ship.m
is explained in Section 37 on three-dimensional modelling,
see page 160.