Graphics Programs Reference
In-Depth Information
plt(x,f(x/2),'--')
Let us try calling
oops
to delete more than one object. (We use a string
cell array in the following call to
text
to label the two curves at once.)
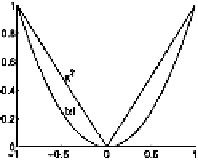
x = -1:.01:1;
f = inline('x.^2');
clf
plt(x,f(x),x,sqrt(f(x)))
xt = [-.5 -.5];
yt = [f(-.5) sqrt(f(-.5))];
text(xt,yt,{' |x|' ' x^2'})
Now get rid of the misplaced labels and try again:
oops(2)
text(xt,yt,{' x^2' ' |x|'})
Example: Figure Positioning
In this example we suppose that we want to set up some windows for
an application that will have two graphics displays and a graphical user
interface. We want the two output displays to occupy the bottom half
of the screen and the GUIshould occupy the top left-hand corner. We
use
get
and
set
to control the position of our figures. Let us create a
figure and get its “position” property:
figure
get(gcf,'position')
ans =
291
445
560
420
But what do these numbers mean? To find out we need to get the units
of measurement of this position:
>> get(gcf,'units')
ans =
pixels
Hmm
...
. What are the available units of measurement?