Graphics Programs Reference
In-Depth Information
MarkerEdgeColor = auto
(and so on)
In the example above we used
get
to get the handle of the line after
we created it. If you know that you will want to modify an object's
properties, you can assign its handle at creation time by using an output
variable. Our example then becomes:
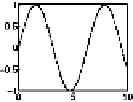
h = plot(t,sin(t));
set(h,'Marker','o')
This technique works for all of the plotting commands,
surf
,
semilogx
,
image
, and so on.
Another way to set object properties is to call a creation function
with a list of property/value pairs at the end of the argument list. Each
kind of graphical object (except the Root object) can be created by
typing a command with the same name as the object. For example, let
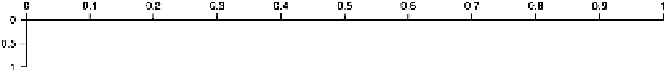
us create a set of axes suitable for plotting range-depth data:
axes('Position',[.1.5 .8 .08],'TickDir','out',...
'YDir','reverse','xax','top')
This call to the
axes
function has specified the position property so that
we get a short, wide set of axes; the direction of the tick marks so that
they stick out of the box instead of into it; the direction of the
y
-axis
is reversed, and the location of the
x
-axis is on top. The capitalisation
of the property names is not important. The name of a property need
not be spelled out in full: you can abbreviate it to the shortest unique
name. In the above call to
axes
, for example, the
xax
property is the
XAxisLocation
.
If you are unsure of the allowed values for a property, you can get a
list of them by typing
set
without actually setting a value. For example,
suppose you know there is an Axes property called
XAxisLocation
but
you do not know whether to type
'above'
,
'top'
,or
'up'
to get the
x
-axis drawn at the top. The solution is to type:
>> set(gca,'XAxisLocation')
[ top | {bottom} ]
Theallowedvaluesforthe
XAxisLocation
propertyare
top
and
bottom
.
Curly brackets are put around the default setting. If you type
set