Geography Reference
In-Depth Information
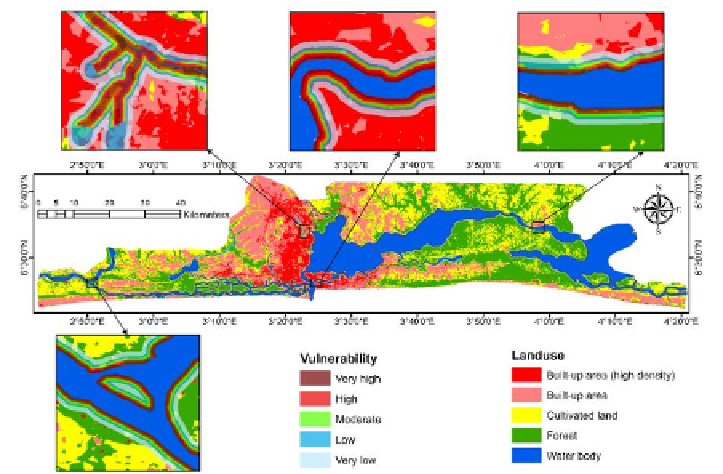
Note: To ensure a more alluring and visual integration among the parameters, the
delineated flood risk areas were set to a transparency value of 30 percent.
Figure 10. Flood risk and land use vulnerability map of Lagos State.
Such high level concentration is found around the western and southern
edges of the Lagos Lagoon. This is why among the high-valued land use
classes, higher density urban area is more exposed to flooding disaster.
A cursory examination of Table 3 reveals that same character is manifest-
ted within the vulnerability class of higher density urbanized land use catego-
ry, i.e. the largest area of land (26.7 percent of the five classes) occupied by
this land use category typically falls within the very high risk vulnerable class.
It is therefore estimated that inundation extent will cover roughly 83 km
2
of
building area within the urban space.
As revealed by the spatial analysis, over 24 km
2
(8.2 percent of the overall
flood prone area) of agricultural land-including cropland and arable land is
exposed to flood hazard. Though roughly half of this lies within the very low
risk vulnerable class, it however exhibits grave implication for food security in
the state.
This is due to the stark reality that the state is experiencing disconcert and
hysterical population inflow leading to further urban expansion and conse-
quently dwindling contiguous agricultural lands.