Geography Reference
In-Depth Information
c
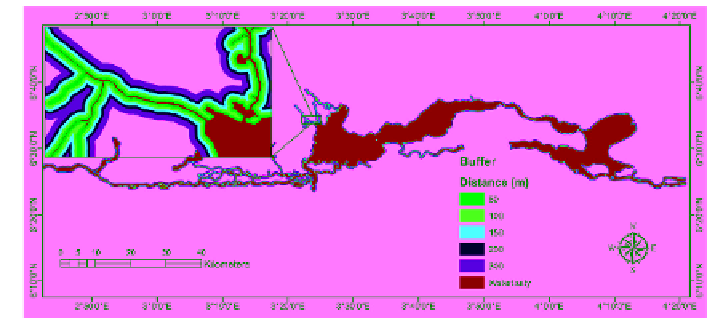
Figure 7. Processed Landsat imagery and its derivatives: (a) Raw Landsat data; (b)
Extracted land use/land cover data; and (c) Five level multi-ring buffered hydrographic
data of the region.
The reason for not selecting more classes is because urban footprints/
coverage is the primary concern in this chapter. The multivariate classification
has an overall accuracy of 88 percent. This was calculated by generating 200
random points within the limit of the region's raster data in ArcMap and sub-
sequently exported to Google earth so as to extract land use/land cover infor-
mation which was later exported back to ArcMap for error matrix and accura-
cy assessment.
From the classified land use data, each of the parameters were converted
to vector format to aid further analysis. The hydrographic feature was
particularly extracted as vector so that spatial proximity analysis can be carried
out on it. The extracted hydrographic parameter consisting of Lagos Lagoon,
Lekki Lagoon, creeks and rivers was further edited by filling in the gaps.
These are void created by dense vegetation cover in the Landsat imagery. A
spatial proximity map was generated (Figure 7c) using this hydrographic data
which involved applying a multi-ring buffer operation to identify specified
distances from the water bodies.
4.3. Buffering Distance Selection
Determining the appropriate distance from the shoreline of water bodies to
the hinterland is not universal especially across countries, organization and
researchers. Some researchers (Adeniran et al., 2013; Oyinloye et al., 2013;