Geography Reference
In-Depth Information
c
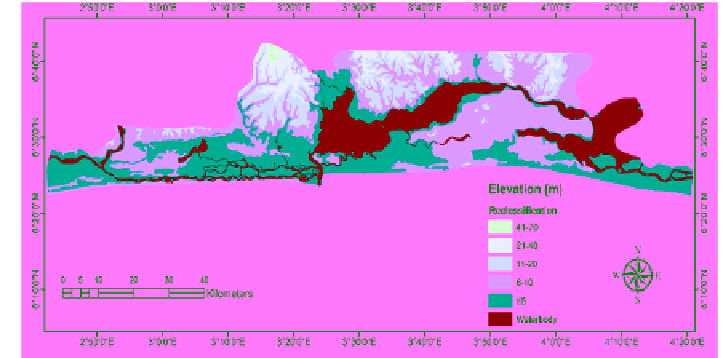
Figure 6. Processed elevation data of the study region: (a) Reconditioned DEM with
vectorized hydrological constituents (in lapis lazuli blue); (b) Extracted contour lines
with specified contour listing; and (c) Vector-based CDTM.
Also, to group the elevation of the region into classes of lowland and high-
land. To achieve this (generate CDTM), the DEM grid was subjected to spatial
analyst surface algorithm to extract list of contour lines (Figure 6b).
The contour lines were further superimposed on the DEM data to assist
and serve as a guide for on-screen digitalization. Thus, the final vector lines
representing the boundaries of each elevation class were converted to polygons
and 5 classes of elevation were identified-≤ 5m, 6-10m, 11-20m, 21-40m, and
41-70m above sea level (Figure 6c).
4.2. Land Use/Land Cover Classification
To estimate the urban footprints of the region for up-to-date flood risk
management and assessment, a zero percent cloud-free Landsat imagery of
2013 (Figure 7a) was preferred because it is recent, noise-free and easy to
classify. The Landsat data is intended for a land use/land cover detection
analysis which will provide vital information on the actual urban extent.
The main purpose of this analysis is to detect the urban built-up area and
agricultural lands in order to identify and calculate the areal extent potentially
vulnerable to flooding hazard. For that purpose the Landsat raster image was
classified after it was transformed from geographic coordinate system to