Geography Reference
In-Depth Information
The average
b
value has become 0.15 lower for the past decade (from 0.95
to 0.8 according to Figure 12 B, b), with an error of
ε
= 3.3-2.9% according to
formula (2). The stability of the estimate can be additionally checked by a
standard deviation reaching 0.09-0.10 at the most significant points (Figure 12
B, b). A
b
decrease is known [42] to indicate deformation and self-
organization in the crust with stress buildup in rigid structures, which may
occur during nucleation of a large earthquake.
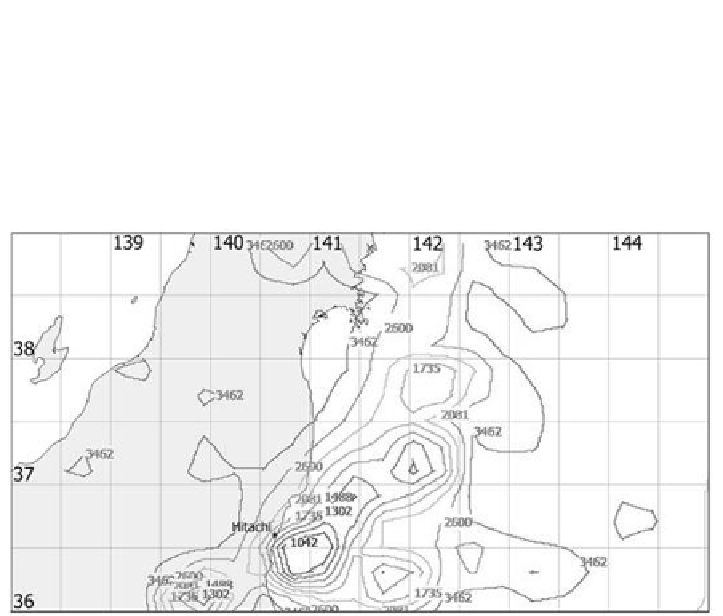
Figure 19.
M
s
=3.5-7 seismicity in 1994-2013; aftershocks are removed. The isolines
(without coloring) show average frequencies of earthquake of a certain magnitude on a
yearly scale.
Relative total energy
released in earthquakes per unit time, normalized to
the background value of mean seismic energy and presented as
log(E
sum
/E
norm
)
,
is another seismicity parameter we study.
This parameter, suggested by P.G. Dyadkov and Y.M. Kuznetsova [44], is
advantageous due to its independence of the spatial seismicity pattern (taking
into account the earthquake density in each cell is not required for the
interpretation of results). The parameter highlights (Figure 20) the structure
and dynamics of the quiescence zone formed two years before the Tohoku
earthquake, since 2008-2009, north of the pending event. About a year before
the main shock, quiescence in this zone gave way to weak foreshock activity,
while another explicit quiescence zone appeared in 2010 west and south of the
shock.