Geography Reference
In-Depth Information
B -
b
variations for earthquakes from the JMA catalog around Fukushima Prefecture
(3.5≤
M
≤7, aftershocks are removed): a) spatial anomalies averaged over 4 years (grid
size 0.4×0.6º, 3.5≤
M
≤7, rms error
σ
≤ 0.3, aftershocks are removed, the oval marks the
source area of the pending Tohoku earthquake); b) time series, averaged over 5 years.
Vertical black bars are one-sigma error bars (
σ
), the oval marks points of
σ
< 0.09; gray
boxes correspond to the number of events; black curve is the number ratio of small-to-
large events.
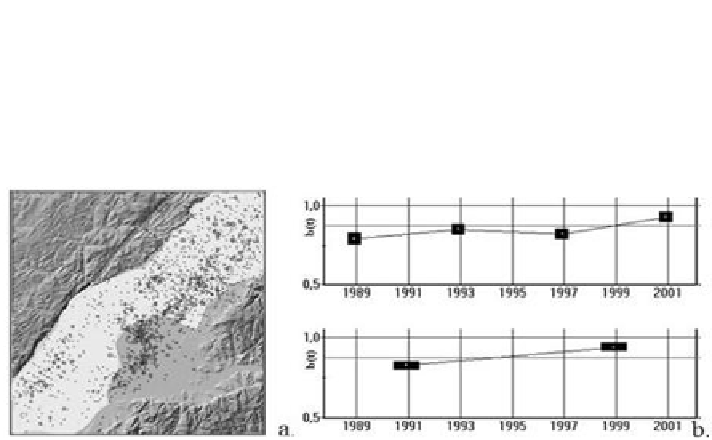
Figure 13. The BRZ area framed in Figure 12 A,
a
(a) and variations in
b
parameter at
every 4 years (b, top panel) and every 8 years (b, bottom panel). Errors in
b
estimates
are shown by segments and calculated by formula (2). The average
b
value increases
from 0.75 to 0.9.
Figure 14. Seismicity in the East Tien-Shan and the adjacent Tarim and Dzungaria
areas. Circles are
М ≥ 3.5
earthquakes between 1980 and 2011. Inset shows
hypocenters along the A-B cross-section, which obviously fall within the orogen.