Geography Reference
In-Depth Information
b)
a mapping algorithm for creating a series of zonal maps at equal time
intervals using linear interpolation of 2D Bessel function (1);
c)
a program for seismic division for simultaneous analysis of several
tectonic areas.
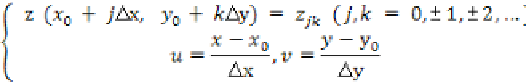
The mathematical method of linear interpolation (2D Bessel function) is:
Z
(
x, y
) = ¼ (
z
00
+
z
10
+
z
01
+
z
11
) + ½ (
u
-½) (
z
10
-
z
00
+
z
11
-
z
01
) +
+ ½ (
v
-½) (
z
01
-
z
00
+
z
11
-
z
10
) + (
u
-½) (
v
-½) (
z
11
-
z
10
-
z
01
+
z
00
) + …
(1)
where Δ
х
=Δ
у
=
h
is a fixed increment and:
The visualization technology of the zonal maps, which uses the 2D Bessel
linear interpolation by (1), includes three stages:
1)
Dividing the area into elementary cells;
2)
Calculating the sought parameter for each cell;
3)
Mapping this parameter (by linear interpolation) for successive time
intervals before a large event.
See Figure 9 for the mapped damage parameter
K
avg
as an illustration to
this technology.
The data analysis
subsystem
includes methods and algorithms [4] for
GIS analysis of earthquake catalogs based on our research and on published
results by experts in seismicity and geodynamics.
The first layer contains procedures of checking the completeness and
quality of catalogs using the time series of earthquake number and magnitudes
(
N(t)
and
Ms(t)
, respectively) [33]. The next layer provides visual analysis of
seismic parameters and consists of a graphical and a cartographical sublayers
(Figure 3). The graphical methods apply to plots, histograms, and diagrams,
including petal and azimuthal diagrams. They are, for example, histograms of
released seismic energy averaged over a selected time interval (
lg E
avg
(t)
,
joules
), magnitude vs. frequency relationship (linear-regression empirical
histograms of the number of events of certain magnitudes), slope of recurrence