Geography Reference
In-Depth Information
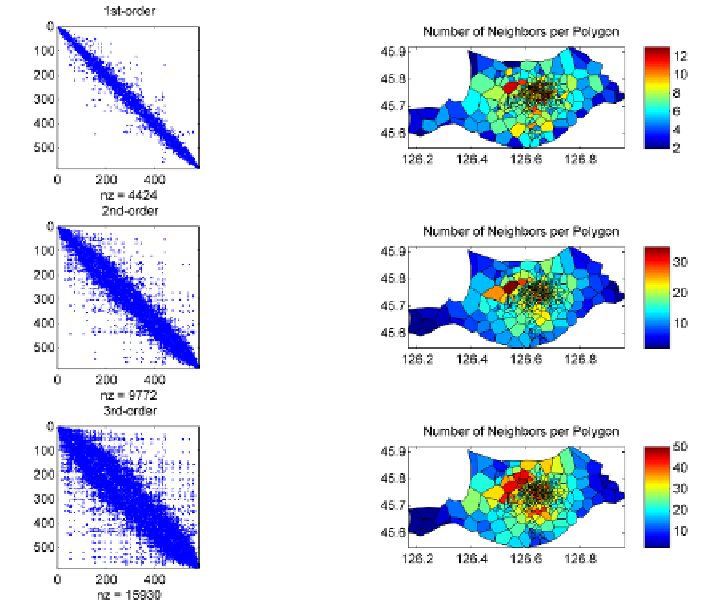
Figure 13. The 1
st
, 2
nd
and 3
rd
-order of spatial adjacency matrix (a dot means the weight
between the two cells is 1; otherwise is 0) and the corresponding distributions of
neighbors for each mobile cell.
In addition, we implement the global Geary's C like STAA measure (
C
st
)
and Getis-Ord's G like STAA measure (
G
st
) to identify the spatio-temporal
autocorrelation of hourly phone-call patterns in different hours. Note that the
C
st
statistic
indicates a positive autocorrelation structure when the value lie in
(0~1); while it is a negative autocorrelation when the value lie in (1~2).
It is found that the hourly autocorrelation trends of
C
st
measures are
more
similar to the
I
st
measures (Figure 14b). But using the
G
st
measure didn't reveal
the temporal dynamics of autocorrelation strength in our datasets. The
G
st
statistic
is also sensitive to the spatial-order of weighted matrix (Figure 14c).