Geography Reference
In-Depth Information
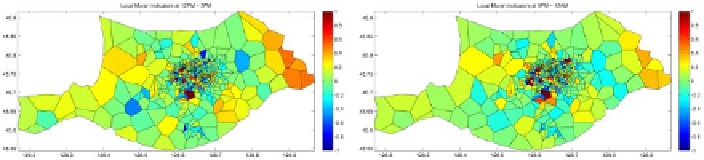
Figure 11. Local Moran's indicators of spatial autocorrelation (LISA) analysis on
phone calls in different time periods of a day (using the 1
st
-order-neighbor spatial
weighted matrix).
There are continuous significant LL spatial associations in the urban
central region and HH association structure in the southwest and northeast
suburb regions which contain large residential housing referring to the Google
Earth imagery
1
in this city. But such spatial autocorrelation structure changes
over time, for instance, the central area tends to have mixture patterns of all
HH, HL, LH, LL association types in the period 9AM~12PM (See Figure
12b).
The spatial weighted matrix plays an important role in spatial autocorrela-
tion analysis (Getis and Aldstadt, 2010). As shown in Figure 13, a larger-order
of spatial adjacency tends to have larger number of neighbors.
Another important factor f or identifying spatio -temporal autocorrelation
structure is time granularity (e.g., half an hour, per hour, two hours and
others). It inspired us to examine how the different combinations of spatial
weights and temporal neighbors affect the STAA results.
Using the methodology introduced in Section 2.3, we implement the
global Moran's I like statistic of STAA with different spatial lags and time
lags for hourly phone-call patterns across all cells. Examining the results
reveals two key findings (See Figure 14a). First, the strength of global
Moran's I like spatio-temporal autocorrelation measure (
I
st
) for hourly phone
calls is temporally dynamic and there is a positive-association peak between 6
AM~7AM. Second, the
I
st
measure is more sensitive to the spatial order than
the temporal neighbors. A higher-order of spatial weights generally results in
higher strength of spatio-temporal autocorrelation structure.
1
The imagery with labels is not shown here as required by the data provider.