Environmental Engineering Reference
In-Depth Information
If cells are not about deterministic behavior, if the behavior
of cells varied and their random behavior had to be studied
and classified, not as an absolute value but as a probability, the
next obvious development had to be the understanding of how
random behavior could generate regular patterns. The works
of Kauffman (1984), Crutchfield (1995), and Holland (1999)
have been important in pointing out the emergent properties of
random complex automata.
Tobler and Burks (1979) work is particularly important in the
field of CAas theywere the first to clearly definewhat was its struc-
ture and basic principles: (i) A grid or raster space - organized
by cells that are the smallest units in that grid/space; (ii) cell
states - cells must manifest adjacency or proximity - the state of
a cell can change accordingly to transition rules, which are defined
in terms of neighborhood functions; (iii) the neighborhood and
dependency of the state of any cell on the state and configuration
of other cells in the neighbourhood of that cell; (iv) transition
rules that are decision rules or transition functions of the CA
model and can be deterministic or stochastic; (v) sequences of
time steps. When activated, the CA proceeds through a series of
iterations (Silva and Clarke, 2002, 2005; Langton 1986, 1995).
For each iteration (time step), the cells in the grid are examined.
Based on the composition of cells in the neighborhood of that
central cell, transition rules are applied to determine the central
state of the cell in the next iteration.
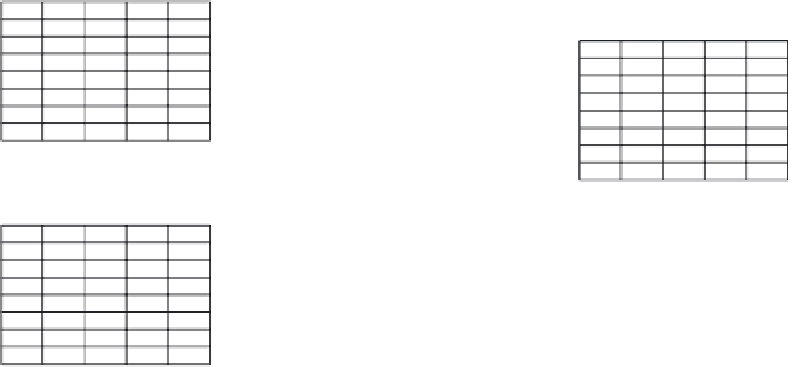
As seen in Fig, 22.3, multiple grids can be used as comple-
mentary information/attributes that will help the development
of behavior in the seed layer(s) allowing for a vertical interac-
tion among different cells (most basic CA only need one matrix
(seed-layer), increasing the number of matrixes will increase the
levels of complexity). This interaction (being vertical or hori-
zontal) was, and still is in many cases, an extremely important
feature of these models, as there are some difficulties in finding
the appropriate data structure that would embed all attributes
in one cell. As a consequence these models require matrixes that
perfectly overlay (geographically referenced) and where the same
cell might have different attributes in each of the layers.
Once vertical interaction (at each individual cell, but accord-
ingly the attributes its has in each layer/matrix) and horizontal
interaction (neighborhood effects among nearby cells - usually
four or eight neighboring cells) happens among cells, a final syn-
chronous update warps the matrix to a newmoment in time with
a new configuration of the matrix (synchronous update), where
cells can assume different values and different spatial configura-
tions. This local self-organization of cells allows the identification
of different regional patterns, sometimes allowing the develop-
ment of new emergent behavior where original conditions would
not anticipate the formation of new/different patterns, but also
the existence of phase-transitions where conditions can promote
for instance boom and bust phases (i.e. sudden increase of speed
of urban cells in a certain area of the matrix).
With the study of random complex CA came an under-
standing of its basic patterns: as they appear to fall into four
qualitative classes, in one-dimension (1-D) CA evolution leads
to: (i) a homogeneous state; (ii) a set of separated simple stable or
periodic structures; (iii) a chaotic pattern; (iv) complex localized
structures, sometimes long-lived (Wolfram, 1984:5).
In 1994Wolframoutlined a number of characteristics that CA
possesses: (i) The correspondence between physical and compu-
tational processes is clear; (ii) CA models are much simpler than
complex mathematical equations, but produce results that are
neighbour of Cell
1
1
1
1
1
0
0
0
0
0
0
1
1
1
1
1
0
0
0
0
0
0
1
1
0
0
1
1
1
0
1
1
1
1
1
1
0
0
1
1
Cell
Matrix A
x, y coordinates
(seed-matric)
T1
attributes:
1 - urban
0 - non urban
Output: T2
Synchronous uodate
of 'seed-matrix'
neighbour of Cell
Cell
222
222
222
222
222
40
40
222
175
175
40
40
222
222
222
222
175
332
175
332
40
322
40
322
40
222
40
222
Matrix B
x, y coordinates
T1
1
1
1
1
1
1
1
1
1
1
0
1
1
1
1
1
1
0
0
0
0
0
1
1
0
0
1
1
1
0
1
1
1
1
1
1
0
0
1
1
175
175
40
40
attributes
222 - owner n. 222
175 - owner n. 175
...
175
222
175
332
40
322
40
222
neighbour of Cell
Cell
70
100
50
0
0
0
0
50
70
0
50
0
70
50
0
0
70
0
50
50
0
0
50
50
0
0
0
100
Matrix C
x, y coordinates
T1
attributes
70 - highway
50 - roadway
10 - foot path
100 - railway
0
50
0
0
0
50
50
50
0
100
0
100
Vertical interaction: among matric A, B, C
Horizontal interaction: Neighbourhood effects
FIGURE 22.3
The cellular environment.


Search WWH ::

Custom Search