Environmental Engineering Reference
In-Depth Information
4
8
7
6
3
5
2
1
N
0
1,000
2,000
4,000
Km
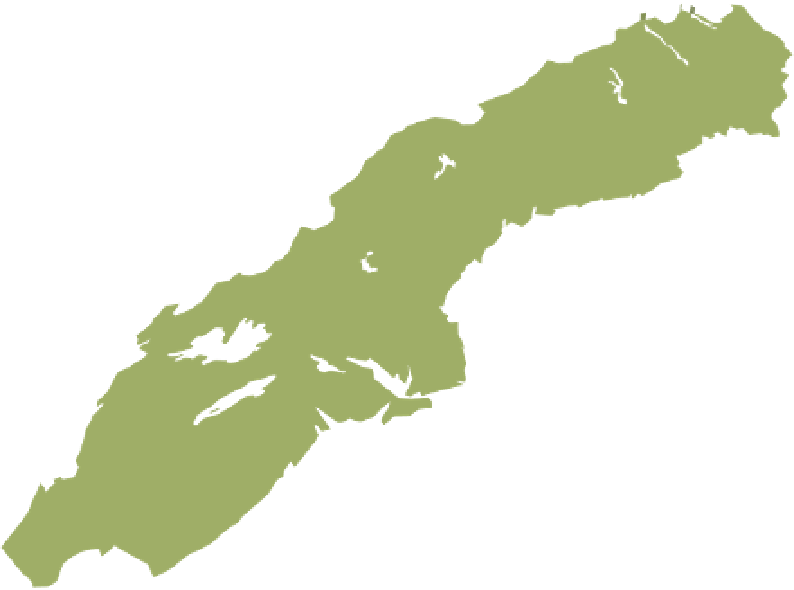
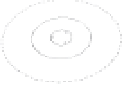
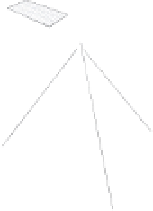
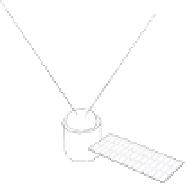
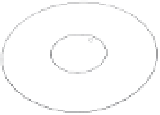
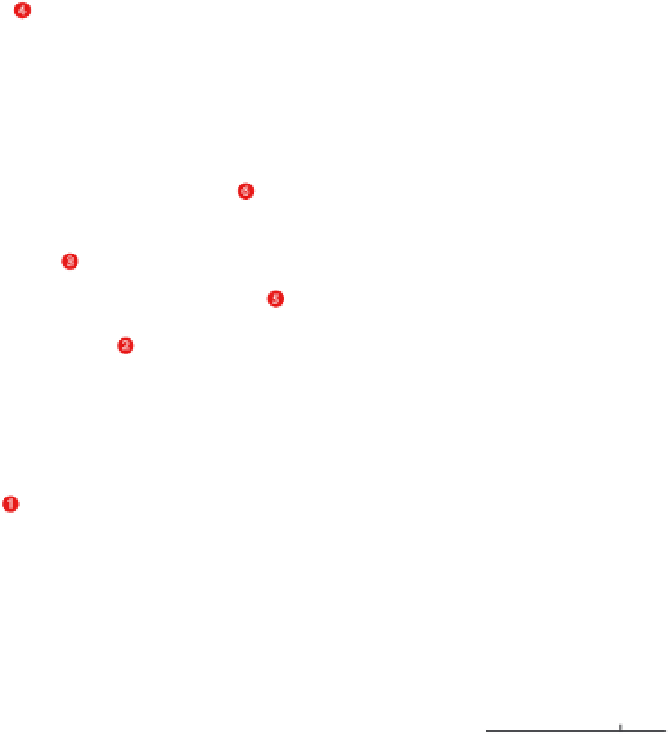
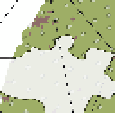
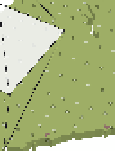
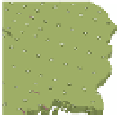
FIGURE 20.3
Illustration of two different long-term monitoring methods in Sweden. 1-4 represent the monitoring of urban
areas within the NILS Urban project; 4-7 represent the NILS (National Inventory of Swedish Landscapes) monitoring program.
(1) A satellite image that covers the whole city and the periurban (surrounding) area. (2) Green areas, e.g., parks, churchyards,
recreation areas, golf courses, urban woodlands, etc. that are accessible to the public are chosen on the basis of the satellite
image. (3) One field plot or a number of field plots (depending on the size of the green area) with a 20 m radius are
chosen within each green area; and (4) field surveys of biodiversity and perception values are conducted within each of
the plots in circles with different radii (Esseen
et al
., 2007). (5) In the NILS program, 12 sample plots (radius 20 m) in each
central landscape square are chosen for survey. (6) Field surveyng is conducted the same way as in the Urban NILS except
recreational values are not recorded. (7) Aerial photographs are taken for each 5 × 5kmlandscapesquare.(8)Digitalaerial
photos are interpreted with the aid of a polarized screen and special glasses. It is possible to see a three dimensional picture
using two aerial photos in a so called stereo model (Allard
et al
., 2003). (Figure created by Erik Cronvall, 2009).
Human perception of biodiversity has mainly been ascer-
tained through interviews (e.g., Bjork
et al
., 2008), a method
that is difficult to use in monitoring because it is costly and
time consuming. Indeed, it is always difficult to measure human
perceptions due to individual and cultural preferences. Within
the NILS Urban project a framework developed by the European
project Visualand (Tveit, Ode and Fry, 2006; Ode, Tveit and
Fry, 2008) was used and consisted of nine descriptions of nine
landscape characteristics (Ode, Tveit and Fry, 2010). Prelimi-
nary studies indicate that it is possible to use field assistants to
estimate the nine landscape characteristics in a systematic way,
thus collecting information during the same field visit that the
biodiversity sampling is conducted. This suggests that it might be
possible to collect valuable data in the field more efficiently than
is possible through interviews.
Tools that could rationalize urban monitoring are developing
rapidly; these include new satellites, computer based interpreta-
tion of images and 3D landscape images (e.g., Olsson, Scheider
and Koukal, 2008). Thus, current monitoring programs need to
be under constant development.
20.6
Applications in urban
planning andmanagement
Remote sensing data are important for applications that aim to
integrate biodiversity conservation and development into urban
planning and management. Such applications involve deriving


Search WWH ::

Custom Search