Environmental Engineering Reference
In-Depth Information
settlements (Falkenmark and Chapman, 1989; Luck, 2007). In
Stockholm, the remnant native deciduous trees and woodlands
support red-list bird species (Mortberg and Wallentinus, 2000)
and the relatively large oak stands support the very high diversity
of invertebrates associated with this habitat (Mortberg and Ihse,
2006).
According to a review by McDonnell and Hahs (2008), the
responses of organisms to urbanization gradients are not pre-
dictable and could be anything from negative to positive, or even
indistinguishable. Furthermore, urban ecosystems and species are
affected in different ways according to the size of the city. Garaffa,
Filloy and Bellocq (2009) found thresholds with respect to the size
of cities, where towns with over 7000 inhabitants were negatively
related to species richness (see also Jokimaki and Kaisanlahti-
Jokimaki, 2003). However, Hedblom and Soderstrom (2010)
found no threshold with respect to size of cities and abundance
of species. Few studies have compared species richness and green
area cover in more than one city at the time. Although Clergeau
et al
. (2006) found differences along the urban-rural gradient
when comparing bird species richness in 19 European cities, it
was difficult to explain the species distribution since they did not
use multiple geographical scales with comparable well-described
habitats.
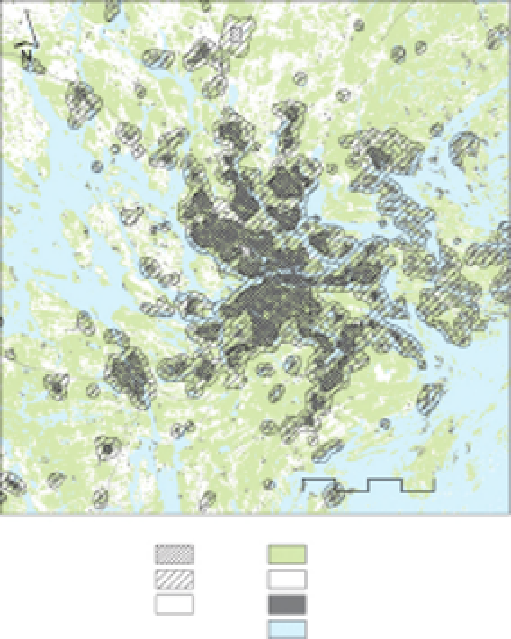
Stockholm
Kilometers
20
0
10
Urban zones
Urban
Land cover
Forest
Open land
Suburban
Peri-urban
Urban
Water
1.00
20.3.2
Using remote sensing to
quantify urbanization patterns
0.90
0.80
0.70
0.60
Pine
Spruce
Birch
Oak
As mentioned earlier, urbanization gradient studies have been
criticized for presenting gradients that are too simplistic (Alberti,
Botsford and Cohen, 2001; McKinney, 2006). Not all cities are
circular and therefore transects are not always the best way of
describing differences. By using remote sensing it may be possible
to describe true gradients within urban areas and thus investigate
patterns within cities (McDonnell and Hahs, 2008). Patterns
within cities could be divided according to the hierarchical levels
suggested by Clergeau, Jokimaki and Snep (2006), including,
for example, patterns within a single residential area or between
residential areas. Such approaches could change some of the
previous results from gradient analyses.
However, in order to find appropriate large scale ecological
and ecosystem functions, it might be of interest to start compar-
ing broad-scale studies, for example, looking at patterns between
cities. In order to facilitate comparative studies between cities
we suggest quantitative measures of urbanization that try to
encapsulate the global process of urbanization and its impacts on
ecosystems and biodiversity (McDonnell andHahs, 2008). Quan-
titative measures of landscapes undergoing urbanization, urban
land use and urban disturbances will be necessary in order to
support studies that start to disentangle how ecological processes
are affected by urbanization. Examples of quantitative measures
that can provide proxy variables for such studies are landscape
metrics, urban formparameters, demographicmeasures, the pro-
portion of impervious surfaces, building density, road density,
traffic noise, night-time light emissions, air pollution and other
physical and chemical measures but also socio-economic factors
and the presence of informal settlements (e.g., Small, 2001; Luck
and Wu, 2002; Wu and Murray, 2003; Small, Pozzi and Elvidge,
2005; Pauleit, Ennos and Golding, 2005; Hahs and McDonnell,
2008; Hepinstall, Alberti and Marzluff, 2008; Mortberg, 2009).
0.50
0.40
0.30
0.20
0.10
0.00
Peri-urban
Suburban
Urban
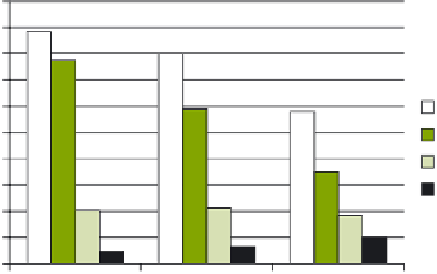
FIGURE 20.2
Differences in the mean volume of different
tree species (m
3
10
−1
/m
2
), mirroring the forest propor-
tion and composition along an urbanization gradient, here
expressed as urban, suburban and periurban zones (see
map for location of zones). The urban zone is dominated
by dense urban areas with small green areas, the subur-
ban zone is dominated by urban areas with larger green
areas and industrial areas, while the periurban zone is dom-
inated by single houses, forest and open land, according to
Swedish Landcover Data (National Landsurvey of Sweden,
2006). The proportion of coniferous and deciduous tree
species in the periurban zone reflect the situation in much
of the hemiboreal forest, while in the urban zone the propor-
tion of deciduous trees is much higher, especially of oak.
Data on forest variables was obtained from Holmgren
et al
.,
2000). Developed from Mortberg (2009).
×
and that deciduous trees are present as a result of vegetation
succession on temporarily abandoned open land. Furthermore,
the concentration of oak and other hardwood deciduous trees in
urban areas of the hemiboreal zone may coincide with the pref-
erence for good soils and microclimate, which also characterize
long-established cities built on or in proximity to early human


Search WWH ::

Custom Search