Environmental Engineering Reference
In-Depth Information
TABLE 19.3
Area and GPP of the four settlement densities.
Area (km
2
)
GPP (g C m
−2
day
−1
)
Settlement
densities
1990
2000
Difference (%)
1992
2001
Urban
14172.58
{
2.0
}
17214.44
{
2.4
}
21.46
1.79 (1.11)
2.00 (1.57)
Suburban
106351.70 {14.9}
134873.06 {18.9}
26.83
3.44 (1.38)
4.80 (2.11)
Exurban
278966.30 {39.0}
304654.02 {42.7}
9.21
4.29 (1.02)
6.10 (1.50)
Rural
315563.94 {44.1}
257125.44 {36.0}
-18.52
4.20 (1.01)
6.03 (1.46)
Numbers in brackets represent percentage of the total study area excluding the removed county subdivisions due to boundary changes. Numbers in
parenthesis are standard deviation.
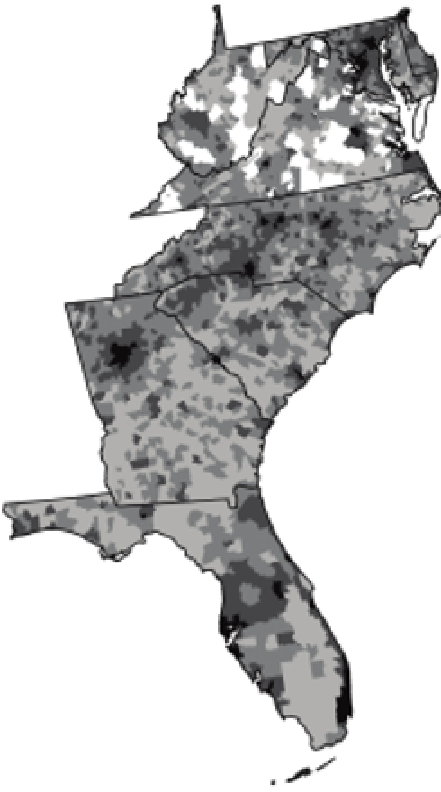
State boundary
Settlement Density
Urban
Suburban
Exurban
Rural
N
0
100
200 km
(a)
(b)
FIGURE 19.3
Distribution of urban (≤0
.
1 hectares per housing unit), suburban (0.1-0.69 hectares per housing unit), exurban
(0.69-16.2 hectares per housing unit), and rural (
>
16.2 hectares per housing unit) settlement densities in 1990 (a) and 2000
(b). The blank area indicates county subdivisions removed due to changes in Census boundaries.
most productive among the four settlement density categories;
the values of GPP for Exurban densities were slightly (1-2%)
higher than those for Rural densities (Table 19.3). Urban densi-
ties were associated with the lowest GPP estimates, accounting
for 41.7% and 32.8% of the estimated GPP for Exurban densities
in 1992 and 2001, respectively. Suburban densities were interme-
diate in carbon uptake through photosynthesis, accounting for
approximately 80% of the GPP produced at Exurban densities in
both years.
Approximately 14% of the South Atlantic study area,
excluding county subdivisions whose boundaries were modified
between 1990 and 2000, experienced transitions between
settlement-density categories (Table 19.4; Fig. 19.4a). Among all
types of categorical transition, the top transition (by area) was
Rural densities converted to Exurban (R
E), which accounted
for 8.53% of the total area. It was followed by Exurban densities
converted to Suburban (E
→
→
S; 4.78%) and Suburban densities
converted to Urban (S
U; 0.42%). The conversion from
Exurban densities to Urban (E
→
U; 0.01%) or conversion from
Rural densities to Suburban (R
→
S; 0.03%) was minor. Con-
versions from higher to lower densities, including six conversion
categories, accounted for 0.21% of the study area in total.
The South Atlantic division saw an increase in GPP by 1.70 g
Cm
−
2
day
−
1
for the region as a whole between 1992 and
2001, which was equivalent to an increase by approximately 42%
against the average GPP value estimated for this region in 1992.
→


Search WWH ::

Custom Search