Environmental Engineering Reference
In-Depth Information
2
0
1.8
2
Precipitation
1.6
Scenario 1
4
Scenario 2
1.4
6
Scenario 3
1.2
8
1
10
0.8
12
0.6
14
0.4
16
0.2
18
0
20
0
4
8
12
16
20
24
28
32
36 40 44
Time [hours]
48
52
56
60
64
68
72
76
80
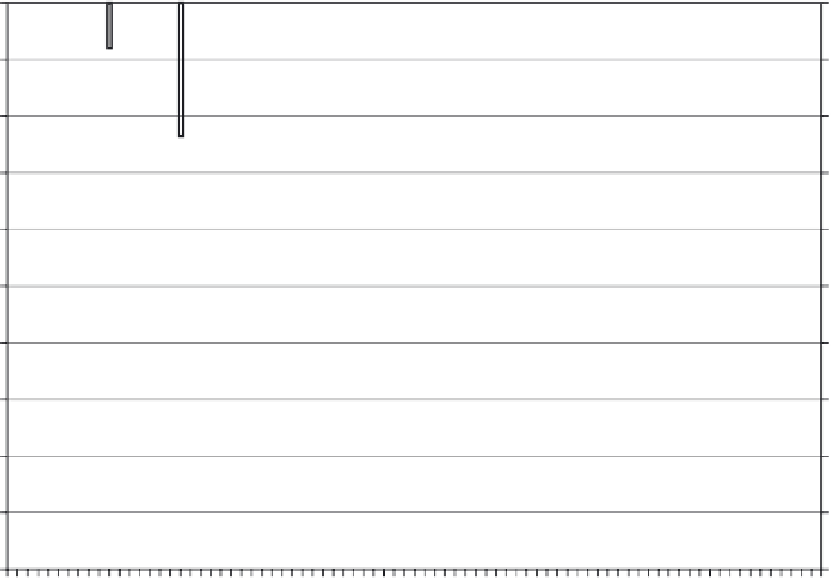
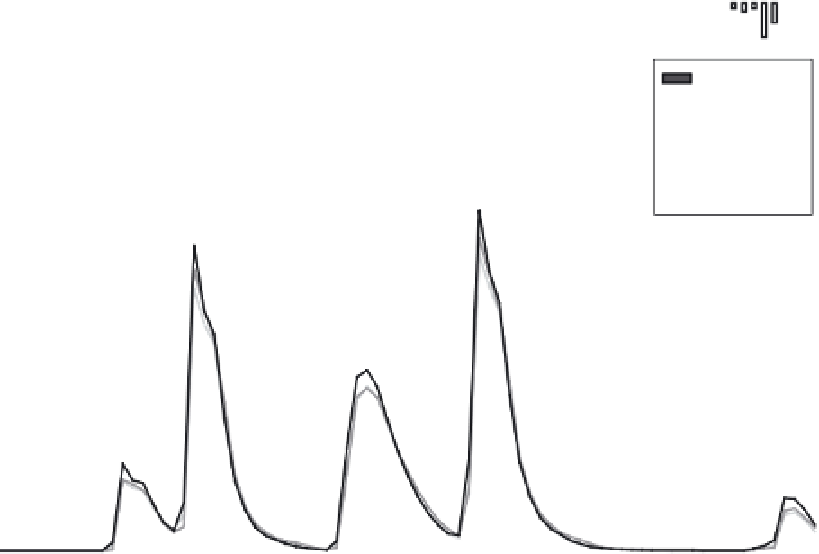
FIGURE 18.8
Comparison of hydrographs for the 3 scenarios using IKONOS data for the period from 3 May 2005 1.00 am
till 6 May 2005 9.00 am.
2
0
1.8
2
Precipitation
Scenario 3 (Ikonos)
Scenario 3 (Landsat)
1.6
4
1.4
6
1.2
8
1
10
0.8
12
0.6
14
0.4
16
0.2
18
0
20
0
4
8
12
16
20
24
28
32
36 40 44
Time [hours]
48
52
56
60
64
68
72
76
80
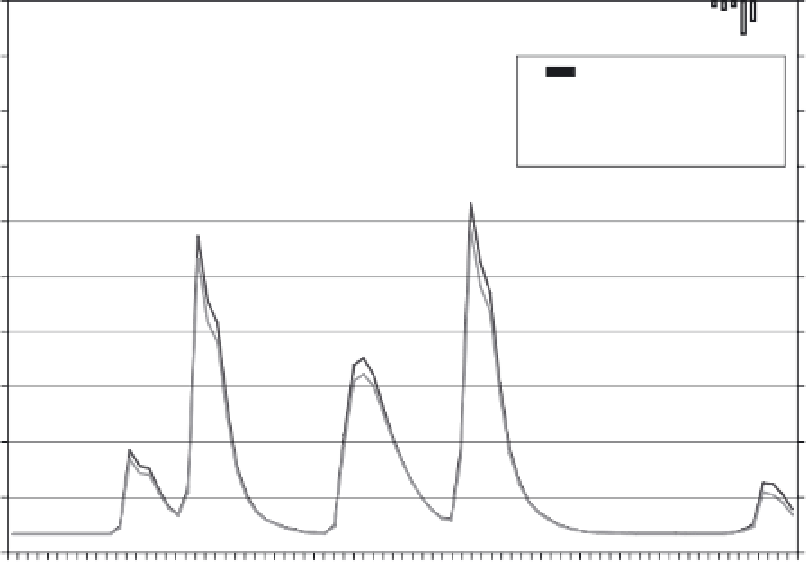
FIGURE 18.9
Comparison of hydrographs for scenario 3 using IKONOS data and Landsat data for the period from 3 May
2005 1.00 am till 6 May 2005 9.00 am.


Search WWH ::

Custom Search