Environmental Engineering Reference
In-Depth Information
110
110
100
100
90
90
80
80
70
70
60
60
50
50
0.0
0.2
0.4
Shape factor
0.6
0.8
1.0
0
10
20
30
40
50
60
Scale factor
(a)
(b)
110
110
100
100
90
90
80
80
70
70
60
60
50
50
0
10
20
30
40
50
60
0.0
0.2
0.4
Shape factor
0.6
0.8
1.0
Scale factor
(c)
(d)
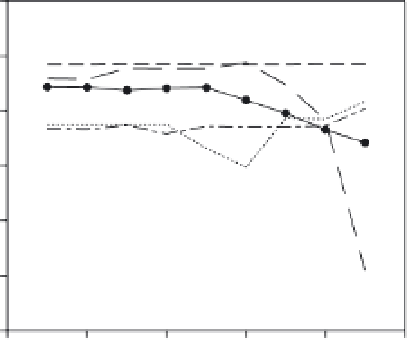
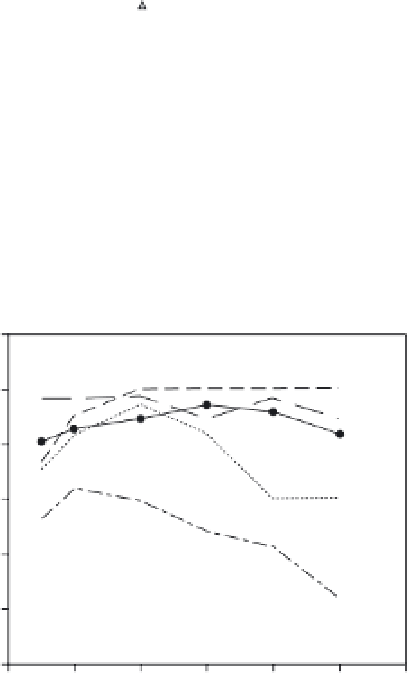
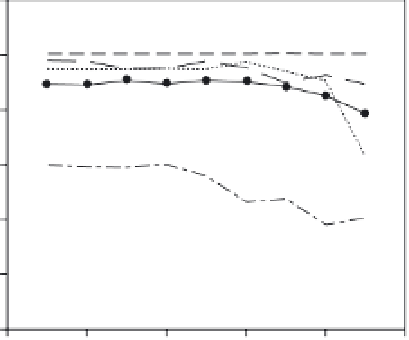
Non-forested Area
Impervious Surface Area
Forested Area
Shadow
Water
FIGURE 17.7
Effects of shape factor (a, b) and scale parameters (c, d) on the accuracy of object oriented classification.
TABLE 17.4
Summary of object oriented classifications accuracies (%) with different feature variables.
Mean brightness
Mean brightness
Mean brightness
Mean brightness
of all bands
of all bands;
of all bands;
of all bands; ratio of
ratio of band 1
ratio of band 4
band 1; ratio of band 4
Land Cover Class
Producer
User
Producer
User
Producer
User
Producer
User
Impervious
94.4
93.2
92.1
94.4
94.2
93.7
94.2
94.5
Forest area
97
81.3
87.4
97.2
97
65.3
87.4
97.2
Water
98.5
100
98.5
94.7
98.5
100
98.5
100
Non-forested
71.9
83
86.6
76.7
55.3
76.7
86.6
79.5
Shadow
95.7
96.7
95.7
98.7
97.7
98.7
95.7
98.7
Overall
90.7
91.3
87.6
92.4
Kappa
85.9
86.9
81.3
88.5


Search WWH ::

Custom Search