Environmental Engineering Reference
In-Depth Information
of impervious surfaces within the sample was calculated through
dividing the impervious surface area by the total sampling
area. Three parameters were utilized to quantify the accuracy
of impervious surface estimation. In particular, the root-mean-
square-error (
RMSE
) (Equation 17.3), the mean average error
(
MAE
) (Equation 17.4), and the correlation coefficient (
R
2
)
(Equation 17.5) between estimated and measured impervious
surface fraction, have been utilized.
17.3.4
Results
The impervious surface fraction images derived from the SMA,
RT, and the integrated SMA and RT approaches are reported
in Fig. 17.5(a, b, and c), respectively. Figure 17.5(a) indicates
that the SMA method successfully quantifies the general pattern
of impervious surface distribution. In particular, the fraction of
impervious surfaces is high in commercial areas (City of Grafton),
and near zero in agricultural and forest areas. Moreover, the
confusion between urban areas and bare soil has been successfully
addressed for the study area. Similarly, theRTmethod (Fig. 17.5b)
has successfully identified the general pattern of land cover in the
study area, with high impervious surface fraction in commercial,
transportation, and residential areas, and low impervious surface
fraction in rural areas. This method, however, may slightly
over-estimate impervious surface fractions in some regions with
bare soils. Finally, the integrated SMA and RT method has also
clearly illustrated the land cover patterns in the study area (see
Fig. 17.5c).
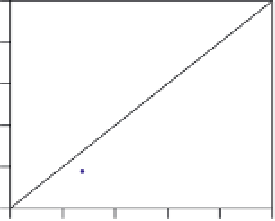
For an objective assessment of these three methods, the esti-
mation accuracies are calculated and reported in Fig. 17.6 and
Table 17.3. Results (see Table 17.3) indicate that regression tree
has the highest overall classification accuracy (90.7%), while SMA
and the integrated approach have slightly lower accuracy (87.3%).
In addition, through visualizing Fig. 17.6 and Table 17.3, several
conclusions may also be obtained. First, the SMA and RTmodels,
which are primarily applied to coarse-resolution remotely sensed
data, can be transferred to IKONOS imagery with similar accu-
racy. As shown in Table 17.3, the
RMSE
s for both SMA and RT
models are about 10-12%, and
MAE
sareabout6-8%,which
are comparable to the reported accuracies when these models
applied to coarse-resolution data (Wu and Murray 2003; Yang
i
=
1
(
I
i
−
N
I
i
)
2
RMSE
=
(17.3)
N
N
1
N
I
i
|
MAE
=
1
|
I
i
−
(17.4)
i
=
i
=
1
(
I
i
−
I
)
2
N
N
R
2
=
(17.5)
i
−
1
(
I
i
−
I
)
2
Where
I
i
is the estimated impervious surface fraction for sam-
ple
i
;
I
i
is the 'true' impervious surface fraction digitized from
aerial photos;
I
is the mean of the samples; and
N
is the total
number of samples. With these three measures, the
RMSE
and
MAE
measure the relative prediction errors of the model, and
the correlation coefficient (
R
2
) measures the fitness of the model.
In this study, all three measures have been calculated for com-
parison purposes. In addition to these percentage based accuracy
assessment, traditional hard accuracy assessment was also per-
formed. In particular, a pixel is classified as impervious surface
if the percentage of impervious surface in that pixel is over 50%,
otherwise this pixel is classified as non-impervious surface.
100
100
100
90
80
70
60
50
80
80
60
60
40
40
30
20
10
0
40
20
20
0
0
0 0 0 0
Actual Impervious Surface Fraction
80
100
0 0 0 0
Actual Impervious Surface Fraction
80
100
0 0 0 0
Actual Impervious Surface Fraction
80
100
(a)
(b)
(c)
FIGURE 17.6
Results of impervious surface estimation accuracy assessment with (a) spectral mixture analysis, (b) regression
tree analysis, and (c) integrated model of spectral mixture analysis and regression tree.
TABLE 17.3
Accuracy assessments of pixel-based impervious surface estimation models.
Root-mean-square-
Mean average
Correlation
Overall classification
coefficient (
R
2
)
error (
RMSE
)
error (MAE)
accuracy
Spectral mixture analysis
10.697
6.716
0.903
87.3%
Regression tree
11.835
7.396
0.865
90.7%
Integrated spectral mixture
analysis and regression
tree
9.687
6.052
0.922
87.3%


Search WWH ::

Custom Search