Environmental Engineering Reference
In-Depth Information
-20
-18
-16
-5
0
5
-19
-17
10
10
5
5
Imp/soil
Soil
Soil
5
5
3
3
0
0
0
0
0
0
Veg
-5
-5
-5
-5
Imp
Imp
-3
-3
Veg
-10
-10
-10
-10
-6
-6
-15
-15
-20
-18
-16
-5
0
5
-19
-17
MNF 1
MNF 2
MNF 1
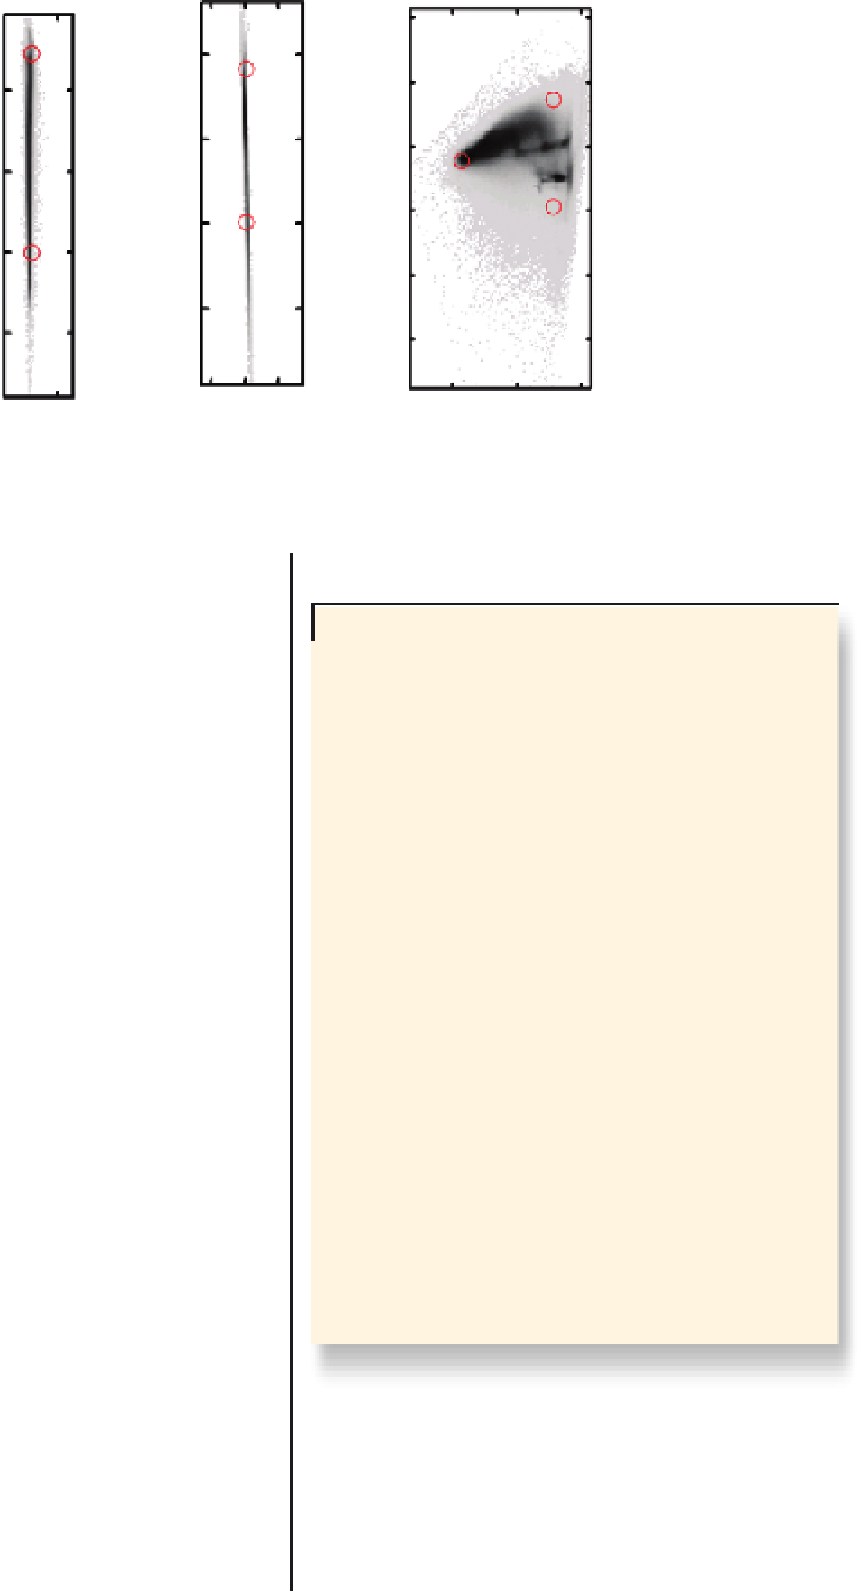
FIGURE 17.4
Feature space representation of the first three MNF components for the normalized reflectance IKONOS image.
Where
M
b
is MNF component
b
for a pixel;
M
i
,
b
is MNF
component
b
for endmember
i
;
f
i
is the fraction of endmember
i
;
n
is the number of endmembers; and
e
b
is the residual. This
model was solved using a least squares method in which the
residual
e
b
is minimized. The outputs of this SMA model are the
fraction images for vegetation, impervious surface, and soil.
TABLE 17.1
Rule definition using the regression tree model.
Rule
Condition
Impervious surface fraction
1
tc3
>
−
30.25508 0
b1
≤
0
.
17878
−
2.17833
+
148 b1
−
41 b3
2
tc1
>
754.3892
−
0.005 tc1
+
0.003 tc2
17.3.3.2
Regression tree approach
tc1
≤
754
.
3892
5.45418
+
273 b1
−
72 b3
−
0.015
3
tc1
+
0.01 tc2
−
7b4
In this section, a regression tree approach has been applied to
the IKONOS imagery for estimating impervious surface distribu-
tion in Grafton. In particular, a regression tree program, Cubist,
developed by Quinlan (1993), was utilized. Eight independent
variables, including four IKONOS reflectance bands and four
Tasseled Cap components, were utilized for estimating imper-
vious surface distribution. The Tasseled Cap components were
generated by following the procedure provided by Horne (2003).
The selections of independent variables are consistent with the
method utilized by the researchers in the United States Geo-
logical Survey (USGS) (Yang
et al
., 2003) for producing the
30
b1
>
0.17878
22.29837
+
270 b1
−
119 b3
tc1
>
1379.779
−
0.019 tc1
−
0.059 tc3
−
0.049
4
tc3
≤−
30.25508
tc4
−
7b4
tc4
>
− 33.24916
b1
>
0.17878
39.21432 + 273 b1 − 119 b3
tc1 ≤ 1379
.
779
− 0.019 tc1 − 0.059 tc3 − 0.049
5
tc3 ≤−30.25508
tc4 − 7b4
tc4
>
− 33.24916
b4
>
0.14026
30 m national land cover dataset (NLCD). For regression
tree model development and assessment, 150 training samples
were generated using a stratified randommethodology to ensure
enough samples within urban areas. A 5
×
29.32636 − 0.526 tc2 + 1439 b4
6
tc2
>
− 713.7446
− 0.352 tc1 + 79 b1 − 45 b3
×
5pixelsamplingsize
was utilized to diminish the effects caused by image misregistra-
tion. With these training samples, a regression tree model was
developed using the Cubist program. The rules developed by the
model are listed in Table 17.1.
tc4 ≤−33.24916
b4 ≤ 0
.
14026
64.3753 − 0.257 tc4
7
tc4 ≤−33.24916
b4
>
0.14026
19.65423
−
0.847 tc2
+
2273 b4
8
tc2
≤−
713.7446
−
0.558 tc1
+
79 b1
−
45 b3
17.3.3.3
Integrated approach
of SMA and RT
b1,b2,b3,b4indicatereflectanceforband1,2,3,and4intheIKONOS
image, tc1, tc2, tc3, and tc4 indicate the Tasseled Cap component 1, 2, 3,
and 4.
Although the impervious surface estimates from both SMA
and RT models appear to be consistent with land cover types,
some problems still exist. For the SMA model, a major prob-
lem may be the selection of endmember's spectra. Except
the multiple-endmember spectral mixture analysis (MESMA)
method (Roberts
et al
., 1998), most SMA models only allow
a single spectrum for a particular endmember, regardless its
internal variations. Although the normalized SMA applied in
this paper attempted to reduce the internal spectral variations
for each endmember, some variations still exist. Therefore, the
choice of endmember spectra may significantly influence the


Search WWH ::

Custom Search