Environmental Engineering Reference
In-Depth Information
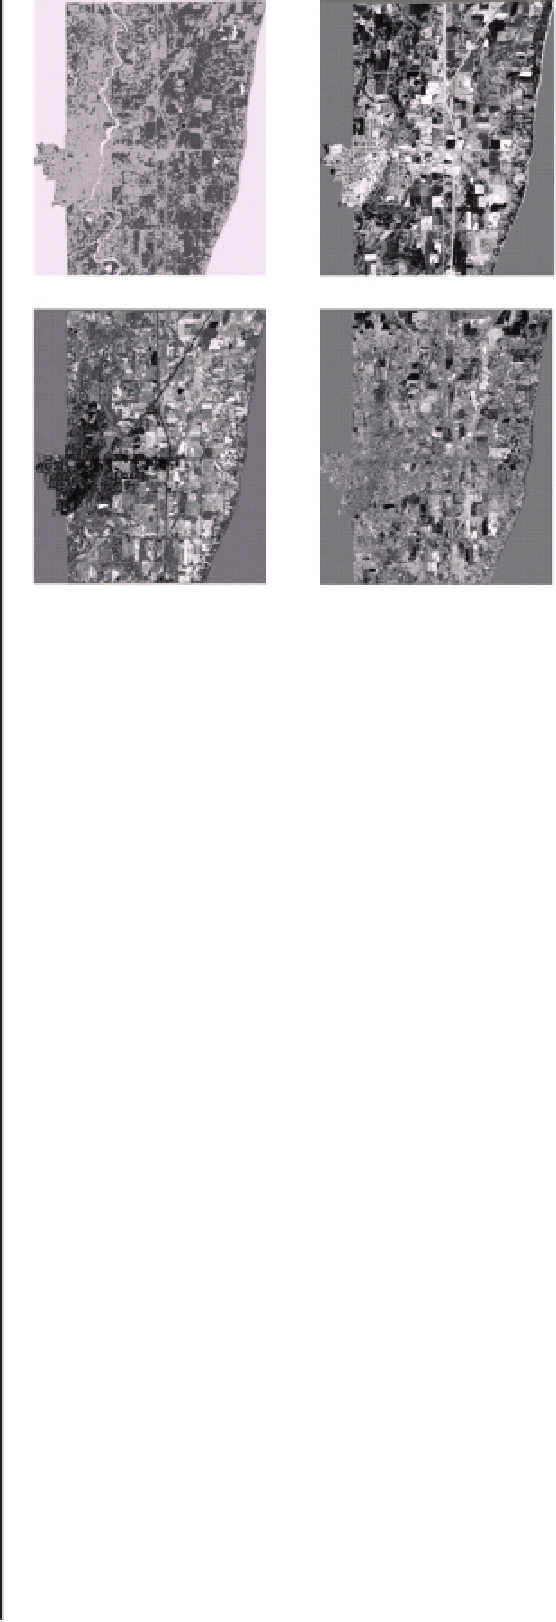
Component 1
Component 2
Component 3
Component 4
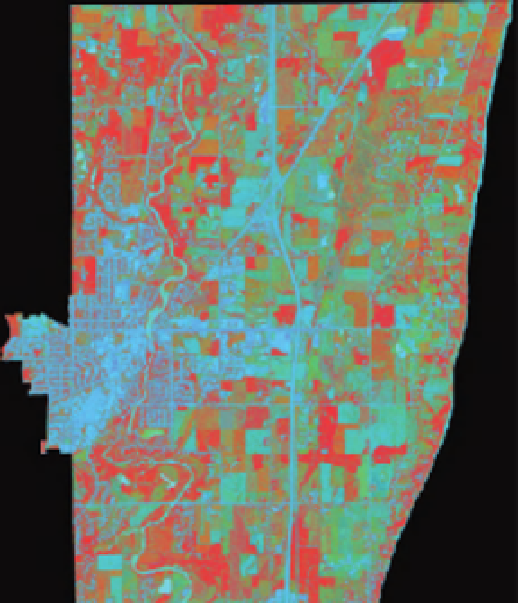
FIGURE 17.2
Normalized reflectance IKONOS imagery for
the study area.
FIGURE 17.3
Maximum noise fraction (MNF) transforma-
tion for the IKONOS normalized imagery.
(e.g., four bands compared to six bands in Landsat imagery). In
addition, a hybrid approach, which integrating the SMA and RT
models, has been developed in this chapter.
for that pixel; and
n
is the total number of bands (4 for IKONOS
imagery). With the normalized image (see Fig. 17.2), the next
step is to perform an MNF transformation. Unlike the princi-
pal component (PC) transformation, which places components
according to their variances, the MNF transformation orders
components according to their signal to noise ratios. Therefore
the MNF transformation is considered superior in keeping infor-
mation (not the variances) in its first several components. In
this study, the MNF transformation was implemented using the
minimum/maximum autocorrelation factors (MAF) procedure
proposed by Green
et al
. (1988). The resulting MNF images
(see Fig. 17.3) indicate close spatial relationships between MNF
components and land cover types. In particular, for MNF com-
ponent 2, high values are associated with urban areas and bare
soil, and low values are related to vegetated areas. In addition,
MNF component 3 is valuable for differentiating built-up areas
and bare soil, with high values for bare soil, and low values for
urbanized areas. This pattern can also be recognized through
analyzing the feature space representation of the first three MNF
components (see Fig. 17.4). It also indicates that it is feasible
to model heterogeneous land uses in the study area using only
three endmembers: vegetation, impervious surface, and soil. The
selection of these endmembers is based on analyzing the feature
space representation and visualizing the IKONOS imagery and
the photographs. With the selected endmembers, an SMA model
has been applied to theMNF imagery for calculating the fractions
of vegetation, impervious surface, and soil in each pixel. This
SMA model was formulated as follows.
17.3.3.1
Spectral mixture analysis
model
SMA assumes that a pixel in remote sensing imagery con-
tains a number of land covers, and the spectrum of the pixel
is a combination of spectra for these pure land cover types,
called endmembers. The fraction of each pure land cover type
can be calculated by modeling the relation between the mixed
spectrum and the spectrum of each pure land cover type. Depen-
dent on the significance of multiple scattering of light on land
cover types, spectral mixture analysis can be divided into lin-
ear and non-linear models. Linear models have been popularly
applied in urban applications, and therefore, utilized in this
section (Phinn
et al
., 2002; Wu and Murray 2003, Wu, 2004).
In this study, a modified normalized SMA model has been
developed for generating the fraction of impervious surfaces.
This model includes three steps: (1) spectral normalization,
(2) maximum noise fraction (MNF) transformation, and (3)
spectral mixture analysis. Spectral normalization (see Equation
17.1) reduces spectral variations associated with absolute bright-
ness, while maintains useful information to separate major land
cover types.
R
b
m
×
100
R
b
=
(17.1)
n
M
b
=
f
i
M
i
,
b
+
e
b
(17.2)
b
−
1
R
b
.
Where
R
b
is the normalized reflectance for band
b
in a pixel;
R
b
is the original reflectance for band
b
x
1
n
where
m
=
i
=
1
i
=
1
f
i
=
1and
f
i
≥
0.
n
Where
;
m
is the average reflectance


Search WWH ::

Custom Search