Environmental Engineering Reference
In-Depth Information
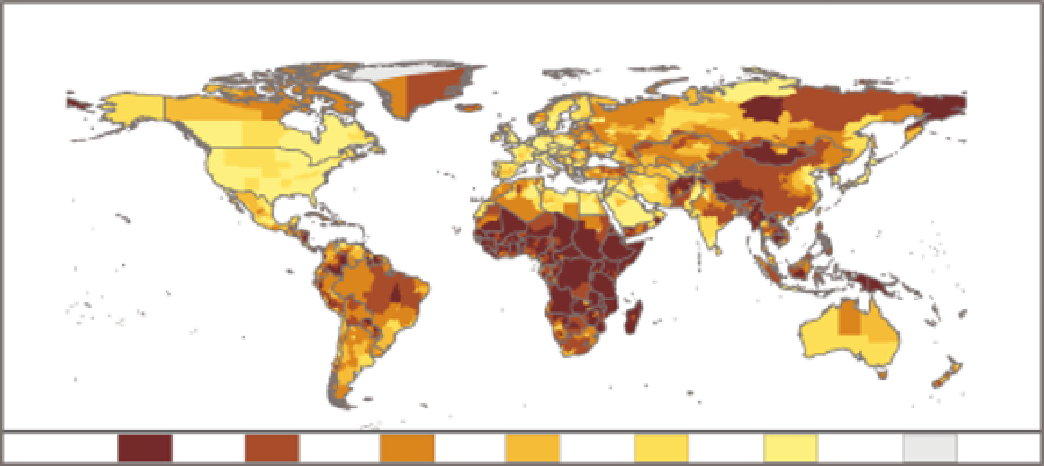
IEA Reported Electrification Rates
Legend
0 - 30
30 - 60
60 - 80
80 - 90
90 - 96
96 - 100
No Data
FIGURE 15.6
Electrification rates published by the IEA for year 2005.
Electrification Rates
Based on DMSP-OLS Nighttime Lights Data
Legend
0 - 30
30 - 60
60 - 80
80 - 90
90 - 96
96 - 100
No Data
FIGURE 15.7
DMSP estimated electrification rates for primary subnational units (states and provinces) for year 2006.
Percent Access to Electricity
100
China
Thailand
90
80
y
=
1.073 x
−
9.9725
R
2
=
0.818
70
60
50
India
40
30
China
20
Congo
10
0
0
10
20
30
40
50
60
70
80
90
100
DMSP Estimated
FIGURE 15.8
DMSP versus IEA estimates of national electrification rates.


Search WWH ::

Custom Search