Environmental Engineering Reference
In-Depth Information
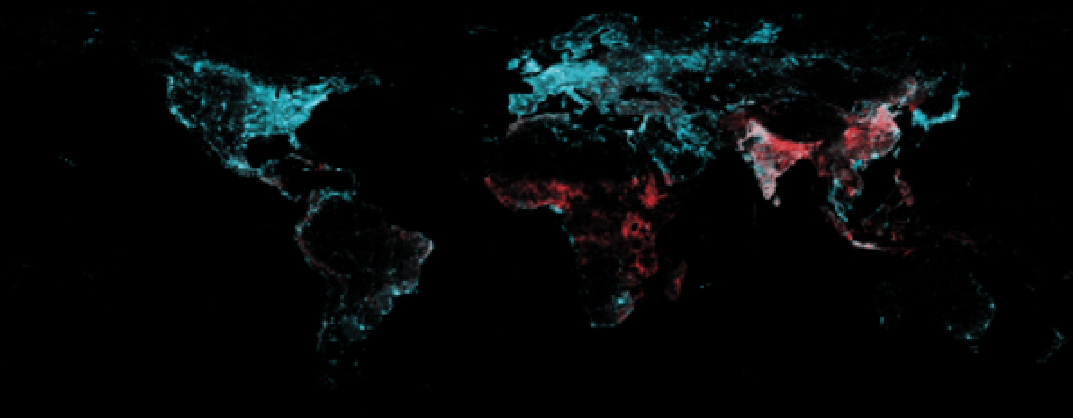
FIGURE 15.1
Color composite image made with the 2006 Landscan population grid as red and the 2006 DMSP night-time
lights as green and blue. In the developed world there is an abundance of lighting yielding a cyan color. Red areas indicate
dense population with no detectable DMSP lighting.
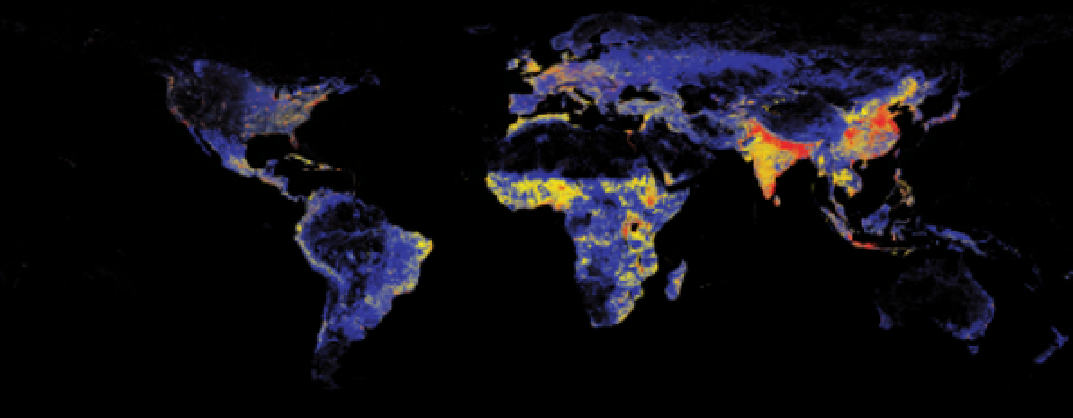
FIGURE 15.2
Landscan population count. Uninhabited areas with population counts of zero are black. Rural areas having
population counts ranging from 1-10 are blue. Suburban and densely populated rural areas with population counts ranging
from 11 to 99 are yellow. Red areas have population counts of 100 or more per grid cell.
15.2.2
Data processing
calculated as:
Population with DMSP lighting (A)
Total population (A
+
B)
×
100
While the fires and background noise were removed in the
production of the stable lights for 2006 - the gas flares are still
present. To avoid overestimating electrification rates in countries
with substantial numbers of gas flares, areas lit by gas flares were
masked out and not used in the analysis. The locations of gas
flares in the DMSP night-time lights had already been determined
in consultation with high resolution imagery available in Google
Earth (Elvidge
et al
., 2009b). The remaining lights are all deemed
to be from electric lighting. A binary mask was generated for
the areas lit by the presence of gas flares. The gas flare mask
was applied to the Landscan grid to zero out the population
count in areas lit by gas flares. A second mask was produced
for the remaining lights. This mask was used to divide the gas
flare free population grid into two segments: (A) population with
lighting detected (Fig. 15.3), and (B) population with no lighting
detected (Fig. 15.4). The percent electrification rate is then
The analysis was conducted at both a national and subnational
level.
15.3
Results
Using the data shown in Figs 15.2-15.4 we estimated the electri-
fication rates for 232 countries - listed in descending population
order in Table 15.1. The national level DMSP estimates are rep-
resented in map form in Fig. 15.5. The total number of people
found to be without electricity is 1.62 billion, only 2.5% larger
than the 1.58 billion estimated by the IEA. The IEA estimates are


Search WWH ::

Custom Search