Environmental Engineering Reference
In-Depth Information
Only some minor color impairments can be revealed at pixel
level by properly zooming some details. The result of GSA-CA
algorithm is shown in Fig. 10.4(e). Only a careful analysis on
the display can reveal some small differences with respect to the
GLP-CA result of Fig. 10.4(d), the GSA-CA result being a little
bit sharper than GLP-CA; on the overall the quality of the two
algorithms is very high and their behavior is nearly the same since
they feature a similar CA model. Figure 10.4(f) reports the image
fused with the GMMSE algorithm. Also in this case quality is
noteworthy. Spectral features are preserved and spatial details are
correctly injected. The comparison of this method with GLP-CA
and GSA-CA reveals that GMMSE has a stable behavior probably
due to the multiresolution estimation of its model parameters.
On the other hand, GLP-CA and GSA-CA fused images show a
higher contrast on sharp edges.
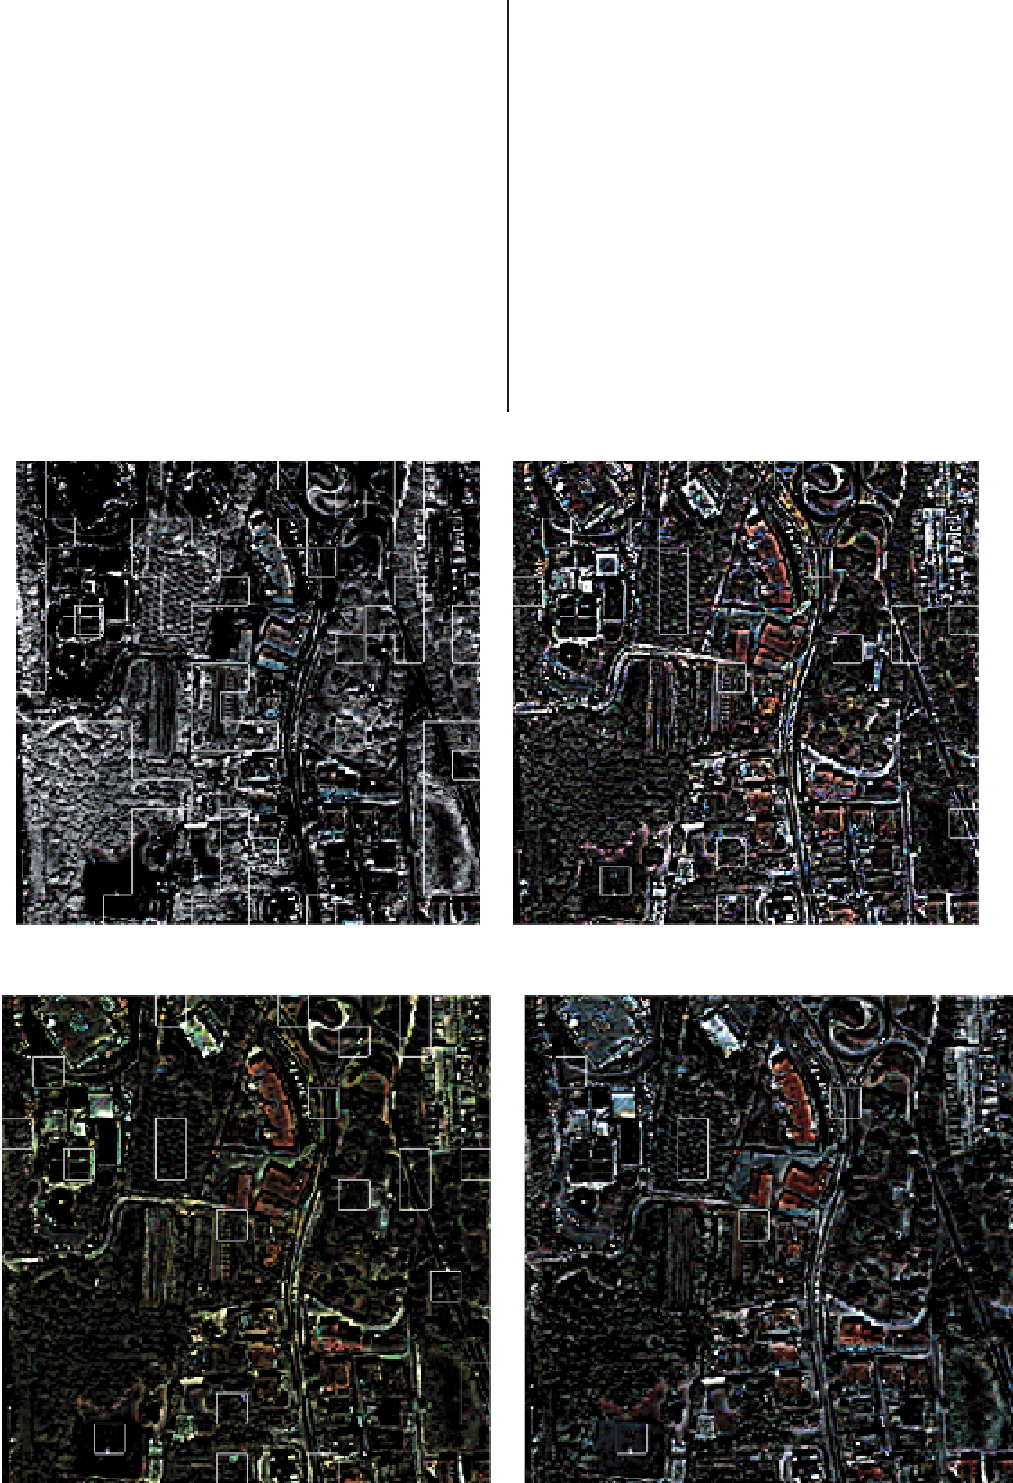
In order to add a further element to evaluate the selected
algorithms, Fig. 10.5 reports the maps of the details that each
method injects into the expanded multispectral images. Details
are represented in full color for the red, green and blue bands.
On each map the contours have been superimposed of those
blocks of size 32
32, on which the spatial distortion
D
s
exceeds
a threshold value of 0.3. Figure 10.5(a), (b), (c) and (d) report
the maps of the GS, GLP-CA, GSA-CA and GMMSE methods,
respectively. Among the evaluated methods, GMMSE obtains the
best results since only very few blocks (7) are flagged. Most of
these blocks occur on vegetated areas and it is likely that errors
in
D
s
are mainly due to texture rather than an incorrect injection
of spatial details on buildings. GSA-CA and GLP-CA present a
greater number of blocks exceeding the threshold, GLP-CA (18
blocks) being a little bit better than GSA-CA (22). Concerning
GS, the number of errors of the algorithm is significant: about
×
(a) Gram-Schmidt
(b) GLP-CA
(c) GSA-CA
(d) GMMSE
FIGURE 10.5
Maps of the details injected by each method into the expanded MS bands of the QuickBird scene. Details are
represented in full color for the red, green and blue bands. The blocks of size 32 × 32, on which the spatial distortion
D
s
exceeds a threshold value of 0.3, have been superimposed.


Search WWH ::

Custom Search