Geoscience Reference
In-Depth Information
Advanced options:
[-b band] [-bs band] [-be band] [-balance size]* [-min]
→
[-bag value] [-bs value] [-comb rule] [-cb filename]
→
[-prob filename] [-pim priorimage] [--offset value]
→
[--scale value] [-svmt type] [-kt type] [-kd value]
[-c0
→
value] [-nu value] [-eloss value] [-cache value] [-etol
→
value] [-shrink]
(a)
12
10
8
6
4
2
0
0
1000
2000
3000
4000
5000
6000
7000
NDVI (*10000)
(b)
0.08
0.07
0.06
0.05
0.04
0.03
0.02
0.01
0
0
1000
2000
3000
4000
5000
6000
7000
NDVI (*10000)
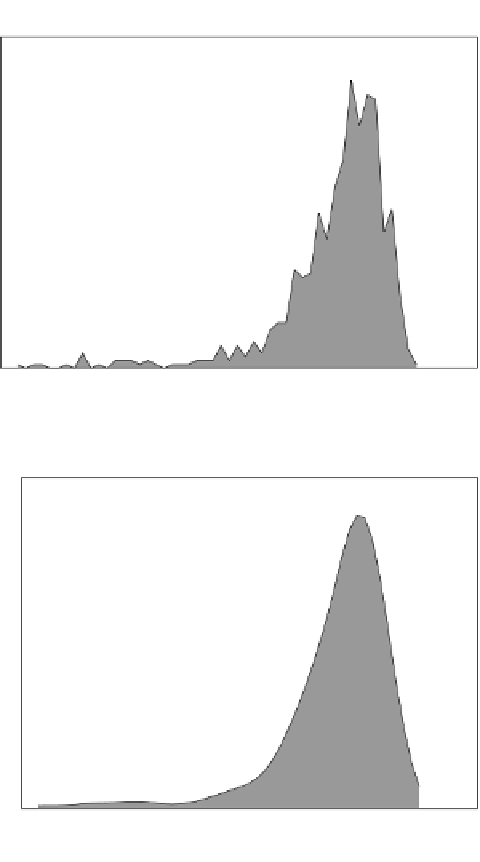
Fig. 12.5
Histogram of NDVI values in forested area.
a
Normalized histogram.
b
Normalized
histogram based on kernel density estimate


Search WWH ::

Custom Search