Geoscience Reference
In-Depth Information
70
Milano
Lodi
65
60
55
50
45
40
35
30
Jan
Feb
Mar
Apr
May
Jun
Jul
Aug
Sep
Oct
Nov
Dec
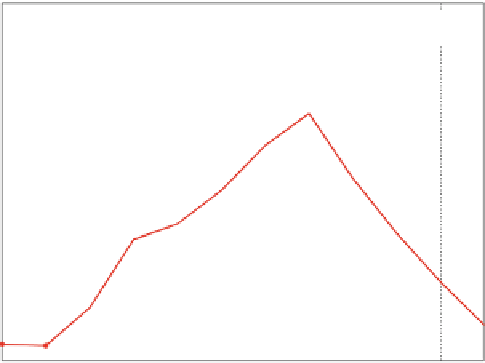
Fig. 12.4
Mean NDVI profiles based on monthly MODIS images. NDVI values are extracted from
pixels covered by the administrative regions of Milano and Lodi (Italy)
pkextract -i modis_ndvi_2010.tif -s nuts_italy.sqlite -ln milano
→
-ln lodi -bn NDVI -polygon -r mean -f SQLite -o
→
modis_ndvi_2010_mean.sqlite
The mean NDVI profiles are shown in Fig.
12.4
. Both profiles show a seasonal
variation with a maximum NDVI reached in summer. After the harvest (August), the
NDVI drastically drops until Winter time. The NDVI reaches higher values in the
region of Lodi than in Milano, which is expected due to the agricultural character
of the region. The example shown here is just for illustrative purposes only. The
analysis of NDVI profiles can be conducted at a much more detailed level if finer
spatial resolution imagery are available and if vectors contain smaller regions. It is
conceivable to evenmonitor individual points and/or pixels using the above approach.
12.4 pkstatogr
The utility
pkstatogr
calculates basic statistics on attributes of a vector file. Exam-
ples of the basic statistics include: minimum, maximum, median, mean and standard
deviation. Histograms (in percentage or absolute values) can also be calculated. The
attribute of interest can be selected using the option
-n|--fname
. Values defined
by the
-nodata
option, or not withing the limits set by the options
-src_min
and
-src_max
are ignored for the statistics.


Search WWH ::

Custom Search