Geoscience Reference
In-Depth Information
(a)
(b)
0
25
50 km
0
25
50 km
(c)
Contour (m)
5000
10000
15000
20000
25000
0
25
50 km
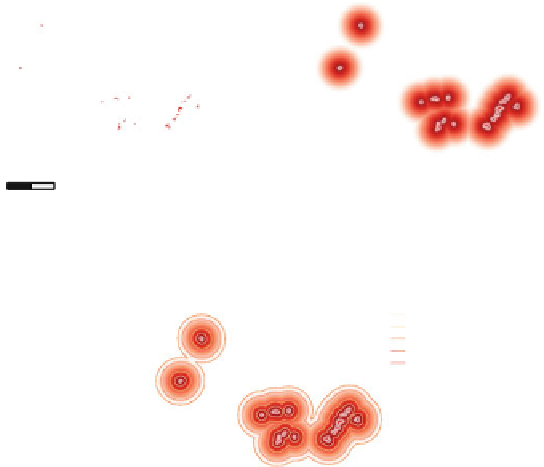
Fig. 10.4
Using
gdal_proximity.py
to create a warning contour around active fire regions.
a
Raster map with active fires.
b
Distance map using
-maxdist
of 25km.
c
Contour vector with
intervals of 5km
gdal_contour -a distance -i 5000 distance.tif warning.shp
10.6 gdaldem
The
gdaldem
command line utility can be used to analyze and visualize a digital
elevation model (DEM) in raster format. Point datasets in a LiDAR format such
utility has seven different modes that produces different types of output: hillshade,
slope, aspect, color-relief, terrain ruggedness index (TRI), topographic position index
(TPI) and roughness. All modes, except for the color-relief mode, use a 3
3moving
window for calculating the output. If the the window contains a no-data value in the
input DEM, the algorithm will produce a no-data value in the output. To interpolate
no-data values, you can set the option
-compute_edges
. Mode specific options
are further described in the respective sections.
×
Usage: gdaldem
ₒ
[hillshade|slope|aspect|color-relief|TRI|TPI| roughness]
ₒ
input_dem output_xxx_map [-of format] [-compute_edges]
ₒ
[-alg ZevenbergenThorne] [b band] [-co name=value]* [-q]


Search WWH ::

Custom Search