Geoscience Reference
In-Depth Information
The next example creates contour lines at 10 m intervals, based on the
digital elevation model (DEM)
st-helens_dsm_10m.tif
we have created in
elevation at every vertex of the resulting polygons. We choose the name “height” for
the attribute in which to put the elevation. The elevation interval between contours
is set to 10 m with the option
-i 10
.
gdal_contour -3d -a height -i 10 -nln 10 -f SQLite
→
st-helens_dsm_10m.tif st-helens.sqlite
(a)
Height (m)
1000
1375
1750
2125
2500
0
5001000 m
(b)
(c)
Contour lines (m)
Contour lines (m)
30
100
0
5001000 m
0
5001000 m
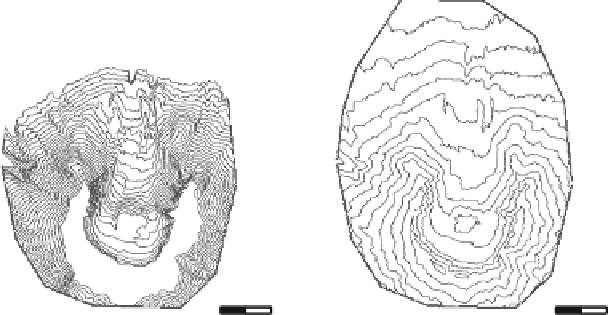
Fig. 9.3
Digital surface model and contour vectors for Mount St. Helens (Washington, US).
a
Digital surface model in raster format.
b
Contours at 30m height intervals.
c
Contours at 100m
height intervals


Search WWH ::

Custom Search