Database Reference
In-Depth Information
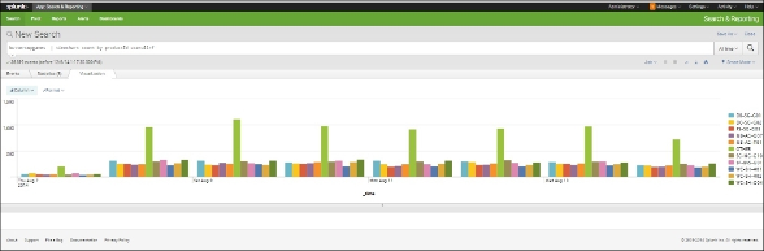
Changing Format to Column Chart
In the previous screenshot, the
NULL
category (colored green in the chart) dominates the
others. We can change the format of the timechart by selecting
Column
in the drop-down
menu immediately above the chart. This format makes it easier to see the distinct categor-
ies of productId. We thus get the following results:
Timechart Presented in Column Chart format
The top command
If we want to better compare our sales for the top
ProductIds
over time, we can use the top
command to do so. So, in the search bar, we enter the following:
buttercupgames | top 5 productId
And the resulting screen appears, as shown in the following screenshot: