Database Reference
In-Depth Information
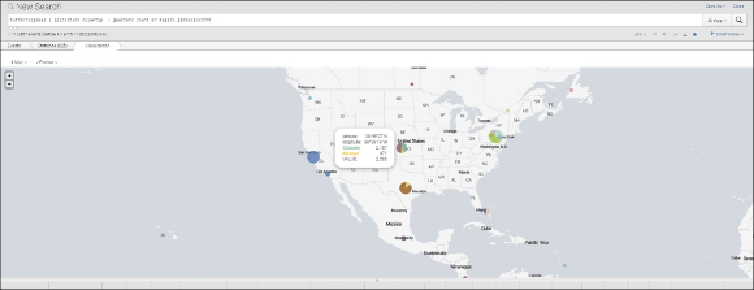
Notice that in this screenshot, the counts of the clientip addresses coming from different
regions have been mapped. However, due to the built-in defaults for the geostats com-
mand, large numbers coming from the Southwest area of the United States have been
grouped together in a colored pie chart. When you mouseover the chart, you see the
counts from
California
,
Colorado
,
Other
,
Texas
, and
Value
. You can zoom in and out on
the map using the
+
and
-
signs on the left. When you do this, you can see bubbles repres-
enting
California
,
Colorado
, and
Texas
.
But you may be asking, what do the
Other
and
Value
labels mean? The
Other
category
represents those client ip addresses that are associated with a count that is less than the de-
fault
globallimit
, which is 10. If you add the code
globallimit=0
, you will be
able to see the mapped locations of all the client ip addresses, regardless of how many
share each location.
Value
is used to represent those locations for which lat (latitude) and
lon (longitude) cannot be determined. So, we can get rid of the
Other
category, but still
have many in the "Value" category, when we use the following code:
buttercupgames | iplocation clientip | geostats count BY
Region globallimit=0
The resulting map shows this change when we zoom in on the region:
Results of Zooming In