Database Reference
In-Depth Information
The built-in General Activity dashboard
Splunk has a built-in General Activity dashboard. To open it, perform the following steps:
1. Go to the Splunk home page.
2. On the
Twitter App
menu, click
Twitter General Activity.
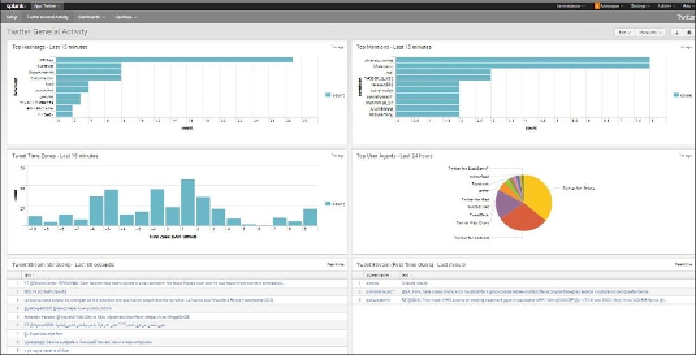
3. You will see a screen similar to the following:
The Twitter General Activity Dashboard
You will see six dashboards, each of which displays interesting information about the 1%
live Twitter stream that you have just sampled from. These dashboards are as follows:
1. Top Hashtags - last 15 minutes
2. Top Mentions - last 15 minutes
3. Tweet Time Zones - last 15 minutes
4. Top User Agents - last 24 hours
5. Tweet Stream (All Users) - last 30 seconds
6. Tweet Stream (First-Time Users) - last 30 seconds