Database Reference
In-Depth Information
Built-in search dashboards
You may not be aware that Splunk has its own built-in visualizations of search activity. If
you go to
Activity
menu, then go to
System Activity
, you will see that you can choose to
look at
search activity
,
server activity
, or
scheduler activity
. Screenshot a each are
shown as follows:
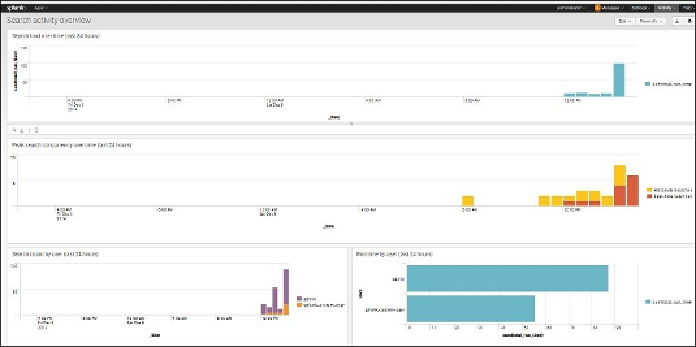
1. First, under
Search
, click
Search activity overview
to see the various panels
showing how the search is evaluated:
Search Activity Dashboard
2. Under
Server
, click
Splunk Browser Usage and Activity
, and you will get a win-
dow like the one shown the following screenshot: