Information Technology Reference
In-Depth Information
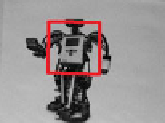
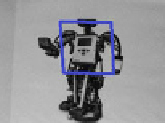
t=1.00s
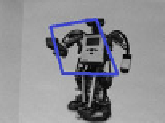
t=3.23s
t=4.00s
t=4.12s
Fig. 3.
GPU-ESM tracking. The second row shows the warped images from the boxed region in
current images (the first row). The result that all warped images are nearly the same shows that
GPU-ESM can track the fast moving object.
t=1.00s
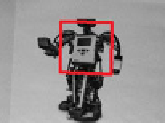
t=3.23s
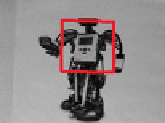
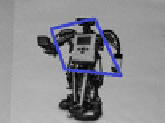
t=4.00s
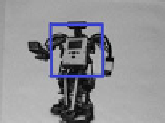
t=4.12s
Fig. 4.
CPU-ESM tracking. The change of warped images shows that CPU-ESM tracking can not
track the same moving object as in Fig. 3.
the GPU-ESM and CPU-ESM tracking sequences are shown separately in Fig. 3 and
Fig. 4. Tracking region is a 200
1
.
00
s
.
The boxed regions in the first row of Fig. 3 and Fig. 4 are warped back with homogra-
phy and shown in their second rows. Despite illumination change and image noise, the
warped regions should be very close to the reference template when the tracking is ac-
curately performed. During the experiment, we start to move the object from
t
×
200 region shown in
t
=
1
.
00
s
.
From the sequences in Fig. 4 we can see the CPU-ESM performs poorly with moving
object (from
t
=
3
.
23
s
tracking error happens, for
t
>
4
.
00
s
the warped regions are to-
tally different from the warped region of
t
=
1
.
00
s
) while GPU can still perform visual
tracking well (the warped regions in Fig. 3 are nearly the same). This experiment shows
that our system performance has been greatly enhanced by GPU acceleration.
=
4.3
Experiment III: Combination Evaluation
Occlusions are added to test the combination performance. The lower ZNCC threshold
is set to 0.6 and the ZNCC value of each frame is plotted in Fig. 5. When occlusion


Search WWH ::

Custom Search