Information Technology Reference
In-Depth Information
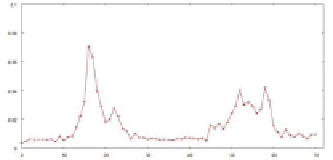
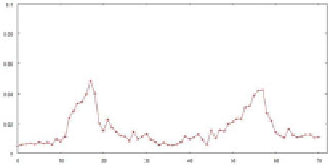
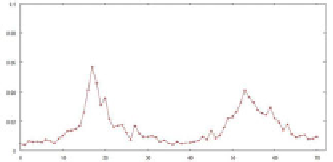
Fig. 3.
Sobel direction histograms for four leaves from the same species
The difference between the gradient histograms is again calculated using the
Jeffrey-divergence distance measure. The confusion matrix for this method can
be seen in table 2. Table 3 shows the correct classification rates for the shape
and texture methods. Whilst the Sobel method only achieved a rate of 66.1%,
it can be seen that though some species are classified more accurately using the
contour method, others do much better using the Sobel method. For instance, the
Agrifolia, the 1982 and the 1998-4292 are well recognized by the contour method,
due to low intra-species variation, and very badly by the Sobel method, possibly
due to uneven lighting in the images. On the other hand, the Ellipsoidalis, the
Turneri and the 2005 are better identifyed by the Sobel method, where flatter
leaves created less shadowing. It may therefore be possible to greatly improve
the overall results by combining the two methods in the correct manner.
Table 2.
The confusion matrix for the gradient histograms
012345678901234567
0 .7 .1000000 .3000 .3000 .30
1 0 .800 .20000000000000
2 00 .7 .200000000000000
3 00 .5 .600 .800000000000
4 0 0.37 0 0 0.43 0.12 0 0 0.06 0 0 0 0 0 0 0 0 0
5 0000 .6 .100 .2000000000
6 000 .800 .200000000000
7 00000 .20 .2 .5000000000
8 00000 .40 .8 .600 .40000 .80
9 0 .30000000 .20 .1 .20 .60 .60
10 0 0 0 0 0 . 60 . 60 0 . 50 0 0 0 0 . 20
11 0 .300000 .1 .2 .70 .9 .10 .40 .90
12 000000000000 .000000
13 0000000000000 .80 .200
14 000000000000 .10 .8000
15 0000000000000 .60 .300
16 0000000000000000 .00
17 000000000000000 .60 .3


Search WWH ::

Custom Search