Information Technology Reference
In-Depth Information
where
are the subspace Contourlet coecients of the target and query
faces and
n
is the subspace dimension. The query image was assigned the iden-
tity of the one with the highest correlation. In the second approach, we used
the feature to subspace distance for classification and assigned the identity of
the nearest subspace to the query face. More specifically, we define face specific
subspaces comprising the subspace Contourlet coecients (i.e. columns of
t
and
q
F
)of
the face as the basis vectors. This is similar to Lee et al. [13] who defined face
specific subspaces using the images as basis vectors. The difference in our case is
that the face specific subspace is defined by features rather than the images. In
the third classification approach, we train a Support Vector Machine (SVM) [11]
using Radial Basis Function (RBF) kernel whose parameters are optimized using
the k-fold cross validation approach on the training data. All three classification
techniques gave similar identification rates however, the first technique consis-
tently gave much better verification results on all three databases. Therefore, we
will report results for classification based on correlation coecient.
4R su s
Three experiments were performed using our database (4347 images of 106 sub-
jects), the extended Yale B database (1710 images of 38 subjects) and the CMU-
PIE database (1344 images of 68 subjects). The number of different illumination
conditions for these databases are 23, 45 and 21 respectively. All images were
with frontal pose. Details of each experiment are given below.
4.1 Experiment 1
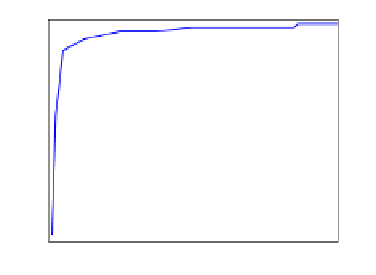
This experiment studies the recognition rate versus the number of subspace Con-
tourlet coecients. This experiment was first performed using the first session
(23 images of 106 subjects) of our database where five images per person were
used for training and the rest for testing. The experiment was then repeated by
100
100
90
95
80
90
70
85
60
80
50
75
40
Horizontal stripe
illumination
Vertical stripe illumination
70
0
50
100
150
200
250
300
350
2
4
6
8
10
12
14
16
18
20
22
Number of coefficients
Image number
(a) (b)
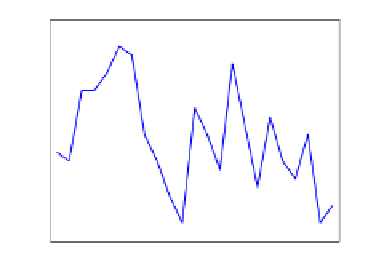
Fig. 4.
(a) Recognition rate vs. the number of subspace Contourlet coe
cients. (b)
Recognition rates for individual images/illumination conditions (x-axis).


Search WWH ::

Custom Search