Information Technology Reference
In-Depth Information
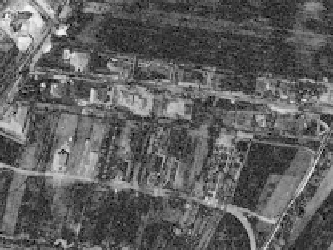
(a) Intensity based difference map (b) Edge based difference map
Fig. 3.
Difference maps
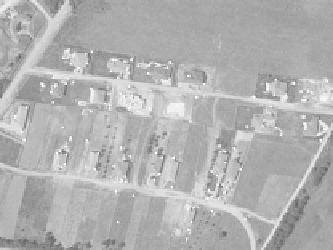
(a) R-based difference map (b) Keypoint detection
Fig. 4.
Logarithmized difference map and result of detection based on the R-function
R
(
...
) indicates the Harris characteristic function (Eq. 1),
1
and
2
are thresh-
olds. It is advised to take smaller
2
,than
1
. With this choice the difference
map is preferred and has larger weight. Only important corners in the difference
map will be marked.
After performing keypoint candidate detection on intensity based and edge
based differency maps, we determined that both of them are too sensitive to illu-
mination change, so altering contrast and color conditions result the appearance
of false edges and corner points and the vanishing of real ones in the difference
map.
Therefore, we decided to use another metric instead of intensity and edginess
and redefine the difference map according to the new metric. The chosen met-
ric was the Harris
R
characteristic function. Therefore the difference map was
calculated as:
I
diff
=
|
R
old
−
R
new
|
(3)
Modification of
I
new
looks as
I
new
=
R
new
.
The logarithm of difference map is in Figure 4(a). As R-function has lower
values, the image can be better seen, if the natural logarithm is illustrated instead
of the original map.


Search WWH ::

Custom Search