Information Technology Reference
In-Depth Information
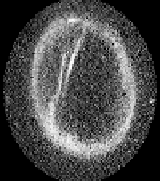
spot moves in time along the oval and the intensity of the oval increases significantly
around this region. Typically, a substorm is characterized by a bulge or a very thick
and bright section of the oval. Space scientists are interested in studying the mor-
phology of the substorm from birth to death. A
Type2
aurora image is shown in Fig. 1
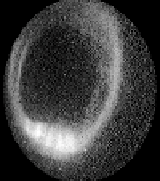
(b). Finally, there are aurora images in which the night side is visible completely and
most or all of the day side is not visible. These images are referred to as
Type3
aurora
images. A
Type3
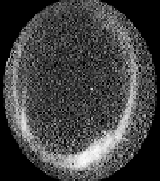
aurora is shown in Fig. 1 (c). Fig. 1 (d) shows an aurora image free
of the transpolar arc and substorm, and both day and night sides are visible. Such an
image is called a standard aurora image.
(a) (b) (c) (d)
Fig. 1.
Various types of aurora: (a)
Type1
aurora, (b)
Type2
aurora, (c)
Type3
aurora, and (d)
Standard aurora
The process of obtaining the hierarchical representation for aurora images is de-
scribed in Section 2. The geometric feature extraction algorithms that utilize the
graph/tree hierarchical structure are introduced in Section 3. The process of extract-
ing various features of aurora for the purpose of classification is discussed in Sec-
tion 4. These features can be used as metadata. Section 4 also presents a method to
identify the different types of aurora using the features obtained. Section 5 discusses
the simulation results. Finally, the conclusion is given in Section 6.
2 Hierarchical Representation of Aurora Images
The input aurora image is thresholded to create a binary image. Although several
thresholding techniques are available, for illustration purposes, the global threshold-
ing method was used. The resulting binary image is processed using a 3x3 median
filter to remove stray pixels and then an edge image is produced. This process is
illustrated in Fig. 2.
The edge image obtained from the filtered binary image is processed using the
boundary based image segmentation and representation system developed by Nabors
[3] to create the graph/tree hierarchical representation. The image segmentation and
representation system consists of four curve segment extraction networks, the line
detector based on two state machines, and post processing algorithms. The curve
segment extraction networks and the line detector are described in Section 2.1 and
2.2, respectively. The system receives thinned edge image as an input and produces a
polyline for an open curve and a polygon for a closed curve. This information is
stored in a hierarchical representation which uses both graph and tree data structures
as described in Section 2.3.

Search WWH ::

Custom Search