Information Technology Reference
In-Depth Information
Haar
Haar
.135
0.08
0.07
0.13
0.06
.125
0.05
0.12
0.04
.115
0.03
orig
0.01
0.05
0.20
orig
0.01
0.05
0.20
0.11
0.02
.105
0.01
0
0.5
1
1.5
2
2.5
3
3.5
4
4.5
5
0
1
2
3
4
5
6
7
8
9
10
LBP
LBP
0.17
0.06
.055
0.16
0.05
0.15
.045
0.14
0.04
0.13
.035
0.12
0.03
0.11
orig
0.01
0.05
0.20
orig
0.01
0.05
0.20
.025
0.1
0.02
0.09
.015
0
1
2
3
4
5
6
0
2
4
6
8
10
12
14
LRD
LRD
0.19
0.11
0.1
0.18
0.09
0.17
0.08
0.07
0.16
0.06
0.15
0.05
0.04
0.14
orig
0.01
0.05
0.20
orig
0.01
0.05
0.20
0.03
0.13
0.02
0.12
0.01
0
0.5
1
1.5
2
2.5
3
3.5
4
4.5
0
1
2
3
4
5
6
7
8
9
10
LRP
LRP
0.15
.075
0.07
.145
.065
0.14
0.06
.135
.055
0.13
0.05
.125
.045
0.12
0.04
.115
.035
orig
0.01
0.05
0.20
orig
0.01
0.05
0.20
0.11
0.03
.105
.025
0.1
0.02
0
0.5
1
1.5
2
2.5
0
0.5
1
1.5
2
2.5
3
3.5
4
4.5
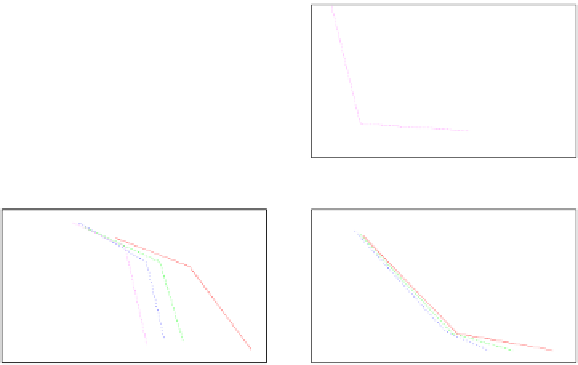
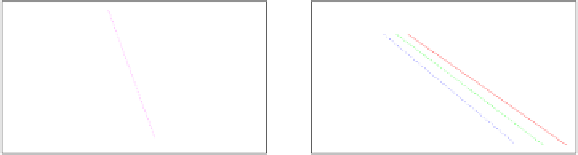
Fig. 5.
Speed-up achieved by suppressing single position for different speeds of the
original detector and different target miss rates
α
. Each line represents results for
different
α
for three original detectors of different speed. X-axis is the speed of classifier
in number of weak hypotheses evaluated on average per single scanned position (left is
faster). Y-axis is area above ROC (lower is more accurate). On the left are results on
eye detection PAL dataset and right are results on frontal face detection MS dataset.


Search WWH ::

Custom Search