Information Technology Reference
In-Depth Information
(a)
Clip 1
(b)
Clip 2
(c)
Clip 3
(d)
Clip 4
(e)
Clip 5
(f )
Clip 7
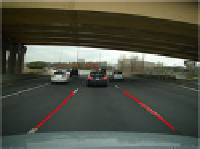
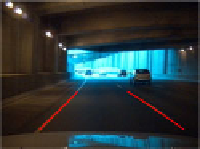
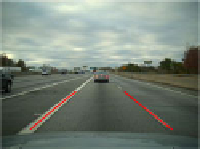
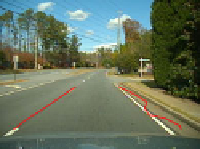
Fig. 9.
Scenes from video clips used in testing with correct lane detections
(a)
Clip 1
(b)
Clip 6
(c)
Clip 8
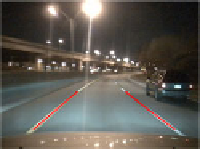
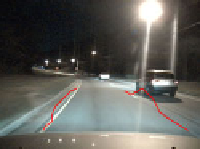
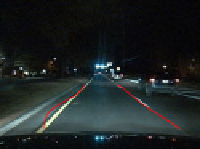
Fig. 10.
Few examples of missed detections
N is the number of computed distances for error calculation (i.e.
N
= 30). Eight
ten minute long video clips were used to evaluate the lane detector. Each video
clip was annotated ahead of time using the
Time-Slice
approach [16]. The errors
represented by E(f) were calculated only when an estimate was considered cor-
rect. Table 1 presents a quantitative evaluation of the proposed system. Methods
of template matching, morphology, and ellipse modeling allows the lane detector
to successfully deal with most issues associated with scattered shadows, illumi-
nation changes, surface irregularities, and presence of vehicles in neighboring
lanes. In addition, the Kalman filter and RANSAC enables detection and track-
ing of markers on curved and winding roads which was initially problematic. A
few scenes from the test clips with correct lane detections are shown in Fig. 9.
A few instances of missed detections are also shown in Fig. 10. Missed detec-
tions were most commonly caused by lens flares from overhead streetlights and
pavements running parallel to the road. The reason behind is this is that both
of these objects produced shapes in the IPM image that closely resembled the
lane marker templates often leading to their detections.


Search WWH ::

Custom Search