Agriculture Reference
In-Depth Information
4
3
2
1
0
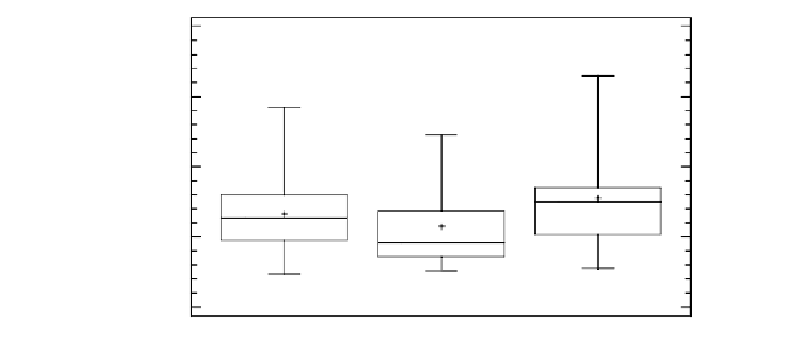
AMER
EUR
ASIA
Figure 6. Box-and-whisker diagram for the 11S/7S ratios in the American, European, and Asian
soybean cultivars studied.
Different mathematical models (simple linear regression, multiple linear regression
(MLR), principal components regression (PCR), and partial least squares regression (PLS))
were applied. Simple linear regression was applied for every peak area with every parameter.
The highest correlations were observed between the plant height and the area percentages
corresponding to peaks 5 and 13, between the linoleic acid content and the area percentages
corresponding to peaks 7 and 8, and between the oil content and the area percentage
corresponding to peak 7. The application of multiple regression models demonstrated that
best correlations were always obtained by MLR analysis. Despite this, no correlation by MLR
was observed for the protein content, the stearic acid content, the maturation time, and the
oleic acid content while a statistical significant relationship (P-value < 0.10) was detected for
the other parameters studied, especially for the palmitic acid and the linoleic acid contents
which presented correlation coefficients of 0.720 and 0.785, respectively, by MLR.
C
ONCLUSION
Soybean cultivar characterization is essential for maintaining genetic purity, estimating
genetic relationship, and identifying soybean germsplams. Nevertheless, differentiation
among soybean cultivars is not an easy task due to their diversity. Different methodologies
based on different molecular markers and phenotypic characters have been tried but no
satisfactory results have always been obtained. Moreover, rapid methodologies are needed to
fulfill requirements of routine and field characterization.
This is the first time a study
comprising the analysis of the protein profiles of 91 different soybean cultivars from
America, Europe, Asia, and Africa has been performed. Protein profiles were obtained by
perfusion HPLC in only 3 min. Despite all soybean cultivars showed the same 14 peaks, the
peak area percentages were different. Indeed, significant differences among soybean cultivars
could be observed by the comparison of peak area percentages being possible to build a
mathematical model enabling the differentiation of soybean varieties in relation to their
Search WWH ::

Custom Search