Agriculture Reference
In-Depth Information
heat flux for DOY 150-155. The simulated values are close to the observations correctly
following the diurnal course of the latent heat flux.
600
Caumont (France), 1986
550
Observed
500
Simulated
450
400
350
300
120
140
160
180
200
220
240
260
280
Day of Year
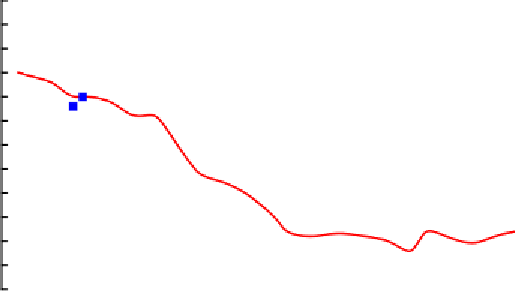
Figure 6. Daily averages of the total soil water content (mm) over a depth of 1.6 m simulated by the
LAPS scheme compared with weekly measurements under a soybean field at Caumont (France) during
its growing season in 1986.
400
Precipitation (368.4 mm)
Runoff and drainage (241.1 mm)
Evaporation (149.6 mm)
Soil moisture (-22.2 mm)
350
300
250
200
150
100
50
0
-50
0
20
40
60
80
100
120
Day of Year
Figure 7. Simulated integrated water balance components (cumulative values) and soil water change for
the first 120 days of integration at Caumont (France). The squares indicate the observations. The
simulations were performed using the LAPS scheme.


Search WWH ::

Custom Search