Geoscience Reference
In-Depth Information
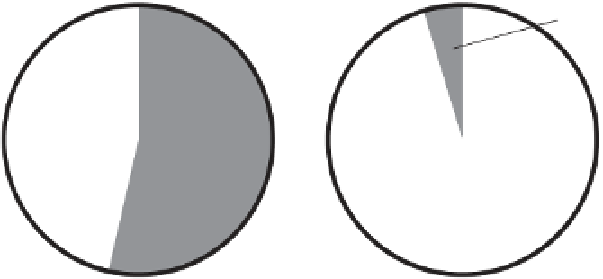
5%
54%
86%
n = 43
n = 229
n = 173
Heavy CaCO
3
skeleton
(low metabolic rate)
Moderate CaCO
3
skeleton
(high metabolic rate)
Little or no CaCO
3
skeleton
Ctenostomata
Rugosa
Gastropoda
Lingulida
Stenolaemata
Bivalvia
Polychaeta
Rhynchonelliform brachiopods
-Infaunal burrowers
Holothuroidea
-Orthida
-Epifaunal, attached
Conodontophorida
-Strophomenida
Nautiloidea
Chondrichthyes
-Spiriferida
Ammonoidea
-Rhynchonellida
Ostracoda
0
25
50
75
100
-Terebratulida
Malacostraca
Acrotretida
Echinoidea
% Extinction
(genus diversity)
Crinoidea
Figure 4.3
Selective extinction during the end-Permian crisis (data from Knoll et al. 2007). Hypercalcifers and other animals that have a limited capacity
to buffer internal l uids lost 86% of known genera; groups with carbonate skeletons but well-developed physiological mechanisms for buffering internal
l uids lost 54% of genera; and groups that use carbonate minerals sparingly or not at all in skeleton formation lost 5% of genera. Colour coding for
individual taxa shows how they align along a gradient of increasing extinction severity. The distribution of taxa along this gradient can be predicted from
expected variations in vulnerability of these different groups to hypercapnia and ocean acidii cation as deduced from physiological experiments. See text for
discussion and references.
in extinction probability (Fig. 4.3). Hypercalcii ers
(corals and massively calcifying sponges) and other
groups with minimal capacity to buffer calcifying
l uids (e.g. lophophorates and crinoids) lost 86% of
their genera during the extinction, whereas genera
of animals and protists that made skeletons of mate-
rials other than CaCO
3
exhibit extinction rates of
only about 5%—comparable to or less than back-
ground extinction rates for the preceding 50 Myr.
Calcifying organisms better able to modulate inter-
nal l uids (mostly molluscs and arthropods) show
intermediate levels of genera loss (54%), and within
this category, groups predicted to be relatively vul-
nerable to hypercapnic stress based on ecology or
anatomy disappeared at rates twice those of groups
deemed less vulnerable. Also, for a series of animal,
protozoan, and algal taxa, genera characterized by
carbonate skeletons showed much higher rates of
extinction than close non-calcifying relatives, pro-
viding some control on physiological variability
among taxa. All of these observations are consistent
with a prominent role for hypercapnia/ocean acidi-
i cation in generating the selectivity associated with
end-Permian mass extinction.
4.2.3
Why the difference?
Clearly, end-Permian fossils record an environmen-
tal catastrophe more dire than the PETM, but why
did the marine biota respond so differently in the
two events? Possibly, end-Permian environmental
disruption was simply more pronounced. Certainly,
the carbon isotopic excursion across the Permian-
Triassic boundary is double that at the PETM. But
there is more to the story. In fact, in our summary of
environmental triggers for end-Permian mass