Geoscience Reference
In-Depth Information
80°S
40°S
0°
40°N
80°N
80°S
40°S
0°
40°N
80°N
240
dpH
T
d
C
T
1994
-0.1
200
2100S
-0.2
160
-0.3
120
-0.4
80
2100I
2300S
+dClimate 2100
-0.5
40
-0.6
0
300
dCO
2
3
dHCO
-
-20
200
-60
-100
100
-140
0
30
dCO
2
R
18
20
14
10
10
1765
6
0
80°S
40°S
0°
40°N
80°N
80°S
40°S
0°
40°N
80°N
Latitude
Latitude
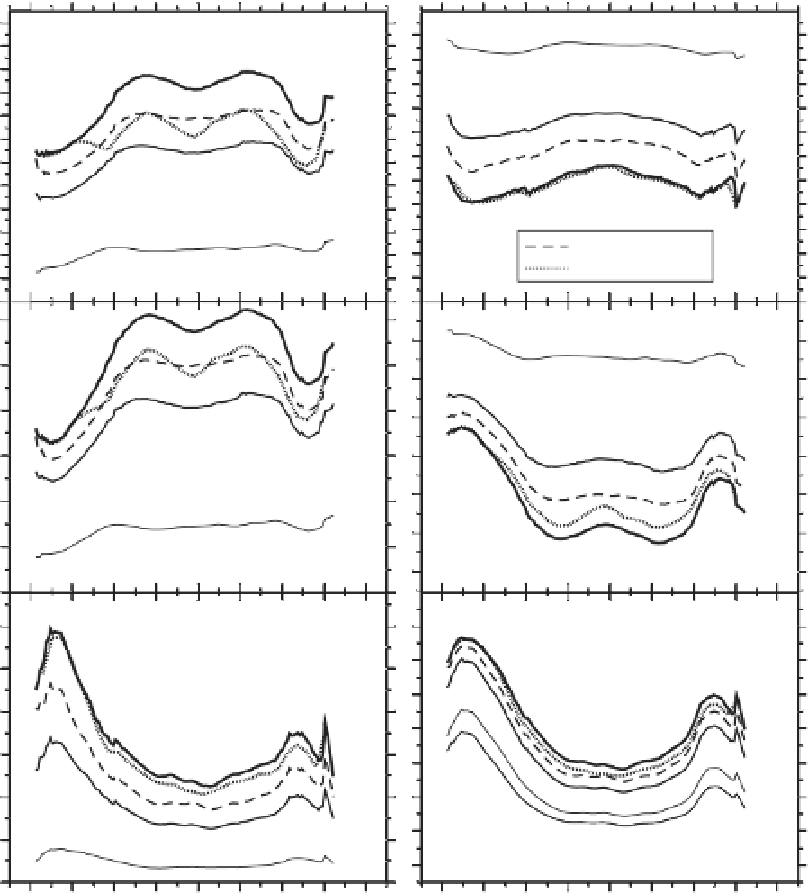
Figure 3.4
Zonal-mean surface changes in C
T
, pH
T
, [HCO
3
-
], [CO
3
2-
], and [CO
2
] during the industrial era until the end of the present century. Snapshots for
the data and model results given indicated as in Fig. 3.2. The
symbol on panels indicates that results are given as perturbations to the pre-industrial state.
Conversely, the Revelle factor, R (bottom right panel), is not given as a perturbation but as its absolute value (its pre-industrial model median is indicated by
1765). Line signatures are as in Fig. 3.3. From Orr
et al
. (2005).
δ
will become undersaturated with respect to arago-
nite (annual-mean Ω
a
< 1) by the time that atmos-
pheric CO
2
reaches 428 ppmv (in 2024 ± 1 yr under
the A2 and B1 scenarios) based on the combined
data-model approach, relying on the CSM1.4 model
output with discrete bottle data collected in the
Arctic in the 1990s (Steinacher
et al.
2009 ). By the
time that atmospheric CO
2
reaches 534 ppmv (in
2050 under A2), annual average Ω
a
drops below 1
for half of the surface waters. By 765 ppmv (in 2090
under A2), the same annual-mean undersaturated
conditions (Ω
a
< 1) occur throughout the water col-
umn. Another model study also under the A2 sce-
nario, but using the CCSM3 model without the