Geoscience Reference
In-Depth Information
R
−1
=∂
ln
C
T
/
∂
ln(
p
CO
2
)
∂
C
T
/
∂
p
CO
2
(mmol kg
−1
ppmv
−1
)
2350
2350
0.12
0.11
0.1
0.09
0.08
0.8
0.6
0.4
0.2
2300
2300
S. Ocean
Tropics
Tropics
S. Ocean
2250
2250
2200
2200
Arctic
2150
2150
Arctic
2100
2100
0.08
0.09
2250
1900
1950
2000
2050
2100
2150
2200
1900
1950
2000
2050
2100
2150
2200
2250
C
T
(μmol kg
-1
)
C
T
(μmol kg
-1
)
ln[H
+
]/
[H
+
]/
H
−1
p
CO
2
(pmol kg
−1
ppmv
−1
)
=∂
∂
ln(
p
CO
2
)
∂
∂
2350
2350
0.78
0.8
0.82
0.84
0.86
18.5
18
17.5
2300
2300
Tropics
Tropics
S. Ocean
S. Ocean
2250
2250
2200
2200
2150
2150
Arctic
Arctic
2100
2100
19
1900
1950
2000
2050
2100
2150
2200
2250
1900
1950
2000
2050
2100
2150
2200
2250
mol kg
-1
)
mol kg
-1
)
C
T
(
μ
C
T
(
μ
ln[CO
2
-
]/
[CO
2
-
]/
S
-1
mol kg
−1
ppmv
−1
)
=∂
∂
ln(
p
CO
2
)
∂
∂
p
CO
2
(
μ
3
3
2350
2350
-0.55
-0.6
-0.65
-0.7
-0.5
-0.4
-0.3
-0.2
-0.1
2300
2300
Tropics
Tropics
S. Ocean
S. Ocean
2250
2250
2200
2200
2150
2150
Arctic
Arctic
2100
2100
1900
1950
2000
2050
2100
2150
2200
2250
1900
1950
2000
2050
2100
2150
2200
2250
C
T
(μmol kg
-1
)
C
T
(μmol kg
-1
)
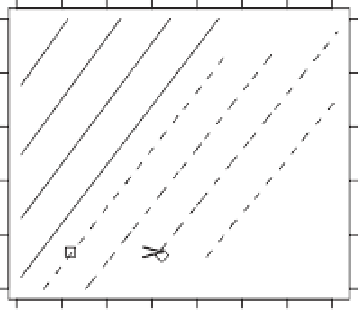
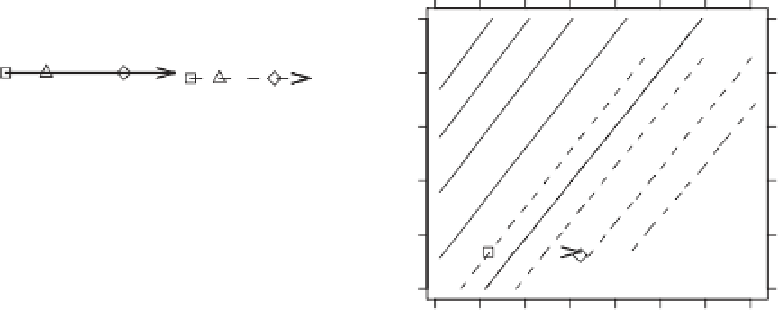
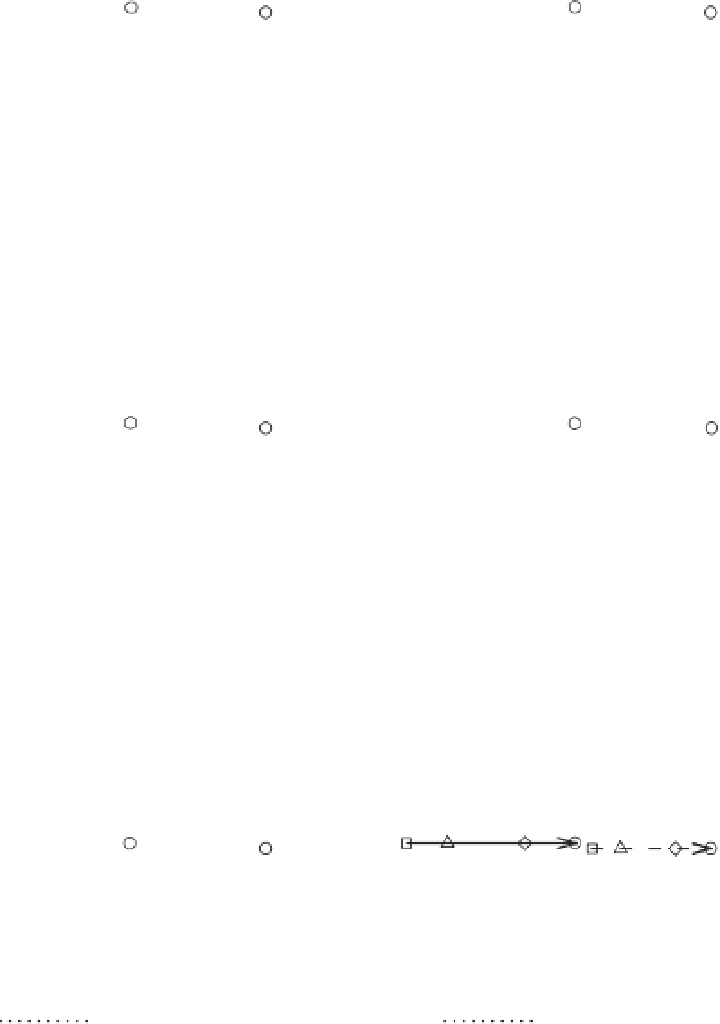
Figure 3.2
A
T
- C
T
diagrams (Baes 1982) of ratios of anthropogenic changes in C
T
(top row), [H
+
] (middle row), and [CO
3
2-
] (bottom row) relative to those
in ocean p CO
2
for the case where C
T
increases but A
T
, temperature, and salinity remain constant. Changes are given in absolute terms (right column) and in
relative terms, i.e. as the fractional change in each species (left column). Arrows indicate projections for the evolution of average conditions in the tropics
(20°S-20°N) and the Southern Ocean (south of 60°S) based on the OCMIP study. The Arctic average results (north of 70°N) are from Orr et al. ( 2005 ) based
on the model from Institute Pierre Simon Laplace (IPSL). Symbols denote pre-industrial (square) and modern (triangle) conditions as well as projections for
563 ppmv (diamond) and 788 ppmv (circle). Solid contour lines (with horizontal labels) are for tropical conditions (T = 27.01°C, S = 34.92); dashed contour
lines (with diagonal labels) are for Southern Ocean conditions (T = -0.49°C, S = 33.96). Contour lines for the Arctic (T = -0.21°C, S = 31.11) are similar to
those shown for the Southern Ocean.