Geoscience Reference
In-Depth Information
Box 3.1 continued
(A)
30
0
120
z
m
2
20
80
O
2
4
10
40
6
k
w
0
8
0
90°S
60°S
30°S
0°
30°N
60°N
90°N
Latitude
(B)
30
Preind.
20
1994
2100S
2100I
10
0
90°S
60°S
30°S
0°
30°N
60°N
90°N
Latitude
(C)
400
Preind.
1994
300
2100S
200
2100I
100
t
gas
0
90°S
60°S
30°S
0°
30°N
60°N
90°N
Latitude
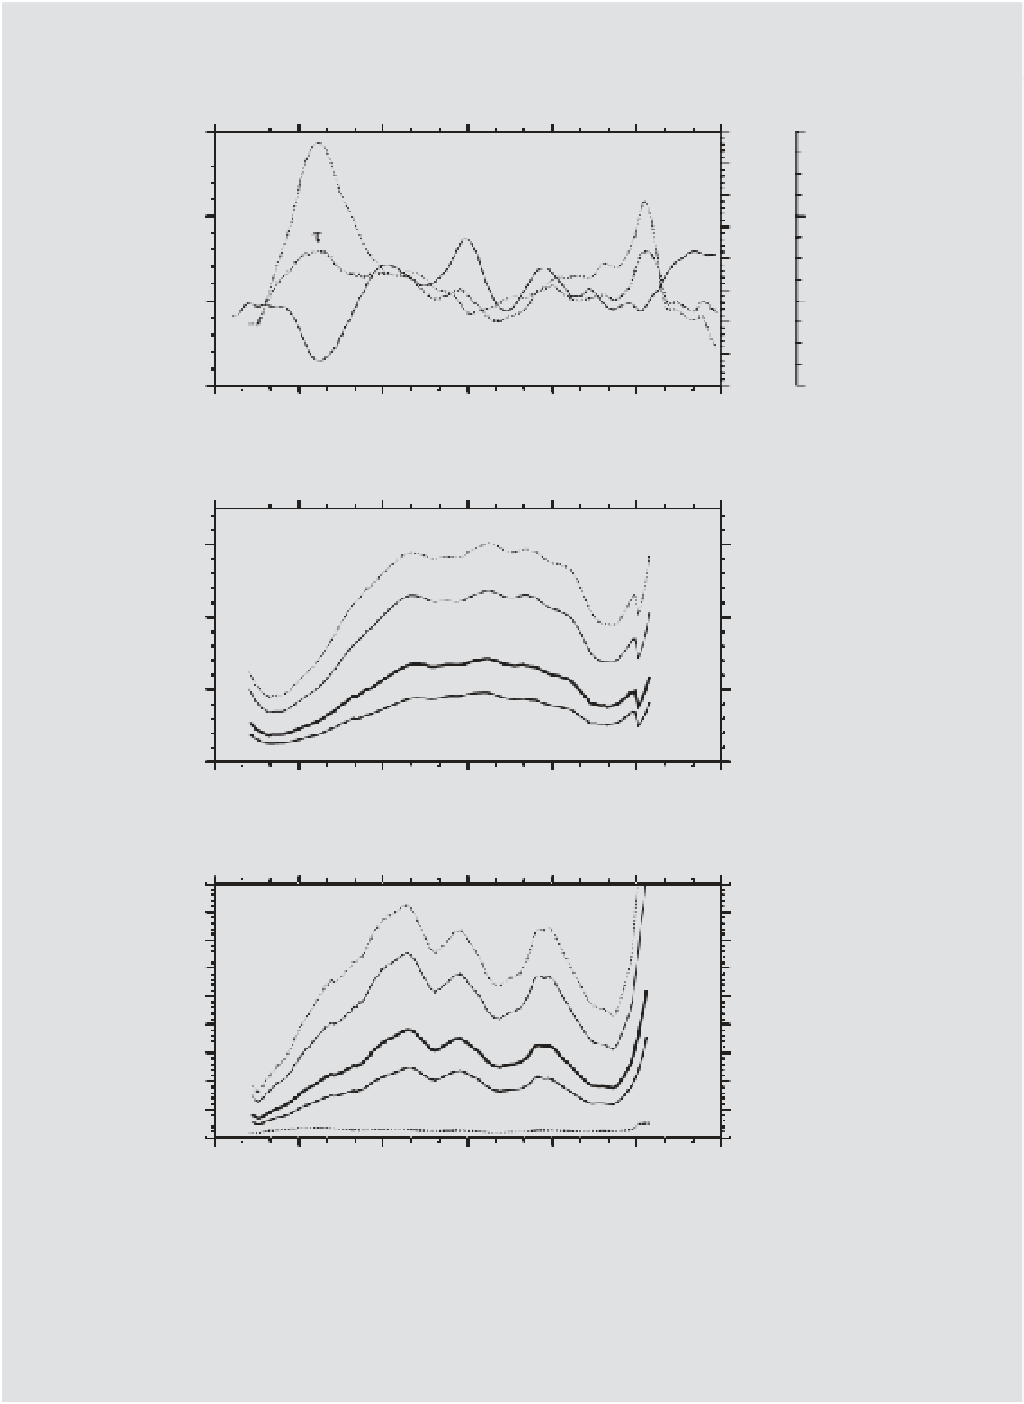
Figure B3.1
Zonal-mean distributions of (A) air-sea equilibration time for oxygen
t
and its determining factors, mixed-layer depth z
m
and piston
O
velocity k
w
, (B) the term
tt
) for the pre-industrial era, the GLODAP central year 1994, 563 ppmv (scenario S650 in
year 2100, 2100S), and 788 ppmv (scenario IS92a in 2100, 2100I), and (C) air-sea equilibration time for CO
2
,
∂∂
C
/[CO]
(equivalent to
T
2
CO
O
2
2
t
, at the same times. In the top
CO
2
panel,
t
was determined from: (1) the global gridded climatologies for the mixed layer depth z
m
(de Boyer Montégut et al. 2004 , variable density
criterion, updated with new proi les collected until September 2009) and (2) the gas transfer velocity k
w
from OCMIP, including the Schmidt number
temperature dependence
O
/660)
−
1/ 2
(Sc
but not fractional sea-ice cover. In the bottom panel,
gas
t
is the same as
t
except that it uses
Sc
instead of
O
O
2
CO
Sc
(making it ~12% greater) and it covers only the GLODAP domain.
O